

Is Involuntary Part-time Employment Different after the Great Recession?
In the period around the 2007-09 recession, the unemployment rate reached its peak at 10 percent in October 2009. In April 2014, the rate was 6.3 percent, suggesting that the U.S. economy continues to recover from the Great Recession. Although the unemployment rate seen in headlines is one of the most-cited indicators of the health of the labor market, economists and policymakers also examine alternative measures of labor underutilization.
These alternative measures are published by the Bureau of Labor Statistics (BLS). The so-called extended measures of the unemployment rate range from U-1 through U-6, with U-3 being the official, or "headline," unemployment rate. (See below.) The U-6 category includes those working part time for economic reasons—the focus of this article; U-6 also includes unemployed individuals and the out-of-the-labor-force individuals who are marginally attached to the labor market. One of the recent concerns is that while the number of unemployed individuals and the marginally attached individuals has been decreasing since 2009, the number of individuals who are working part time for economic reasons (PTER) has remained elevated (almost 7.5 million workers in April 2014).
An individual is counted as PTER if he or she works fewer than 35 hours per week, wants to work full time and cites slack business conditions or inability to find a full-time job as a reason for not working full time. Consequently, if a large number of people are working part time for economic reasons, the economy is not using its full labor potential even though the official statistics count such workers as employed.
In this article, we examine the data on PTER in the aftermath of the Great Recession and compare those numbers with data from earlier recessionary periods. We found that the ratio of PTER to unemployment behaves similarly to the way it behaved previously during a recession: It increases at the business cycle trough and reaches its highest point at the business cycle peak.
Defining PTER
We used monthly microdata from the Current Population Survey (CPS). The survey asks respondents about their hours worked in the previous week; the respondents are then classified as part-time (0-34 hours) or full-time (35+ hours) workers. If they are employed, currently at work (as opposed to being sick or on leave, for example) and usually work fewer than 35 hours (at all jobs), they are asked if they would like to work full time. If they answer "yes," then they are asked the main reason they work part time; their answers are coded as either economic or noneconomic. The economic reasons for remaining employed part time despite wanting a full-time job include slack work, only being able to find part-time work and seasonal work.1 If they give an economic reason, they are asked if they are available to work full time. Their availability and desire to work full time indicate the extent to which economic conditions affect their employment; essentially, they are involuntarily working part time instead of full time. Additionally, the PTER group in U-6 includes those who usually work full time but actually worked part time for an economic reason in the week that the survey was conducted.
In Figure 1, we note that U-3 and U-6 have slowly moved downward since April 2010. The gap between these two series has remained wide since the beginning of 2009, and U-6 still remains at significantly higher levels than observed in the past. Figure 1 also shows U-4 and U-5. By comparing the alternative measures of labor underutilization, we can see that discouraged workers (included in U-4) and marginally attached plus discouraged workers (included in U-5) do not account for a large share of U-6 (which includes U-4 and U-5). Instead, most of the difference between U-3 and U-6 is due to workers who are employed part time for economic reasons, which we see when moving from U-5 to U-6.
Figure 2 shows those who are working part time for economic reasons as a share of the civilian noninstitutional working-age population. The ratio appears countercyclical: increasing during the recessions (from peaks to troughs), and decreasing afterward. As can be seen, the fraction of PTER as a share of the population was higher in the latest recession than in the previous recession. During the Great Recession, the series reached 3.8 percent in 2009 and then declined to 3.2 percent in 2013.
Figure 3 shows the ratio of those working part time for economic reasons to the number of unemployed workers. The ratio appears procyclical: decreasing during recessions and increasing afterward. That is, during recessions PTER grows at a slower rate than unemployed workers. The fraction of PTER to the number of unemployed workers was about 10 percentage points higher at the trough of the Great Recession than at the trough of the 2001 recession. (In contrast, the fraction of PTER as a share of the population [Figure 2] was twice as high in the 2007-09 recession than in the previous recession.)
Notably, 1 percent of the total population has not been working full time since 2009 because it can find only part-time work. (See Figure 4.) This level is similar to the ones observed in previous downturns. In contrast, the share of the population citing slack work/business conditions spiked in 2009 but has since been declining. Slack work/business conditions are affecting a significantly higher fraction of the population than after the 2001 recession.
Conclusion
As the economy continues its recovery from the Great Recession, we expect the number of those working part time for economic reasons to fall. However, it is probable that the ratio of PTER to unemployment will continue to increase as it has historically done. That is because, during the recoveries, the number of unemployed people typically declines faster than the number of those working part time for economic reasons, as reflected in the persistent gap between U-3 unemployment and U-6.
Unemployment Rates
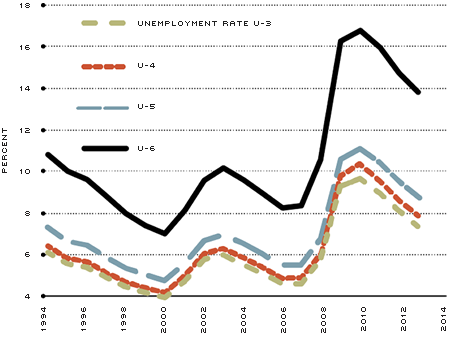
NOTE: The figure shows the official unemployment rate (U-3) and some of the alternative measures of labor underutilization from the Bureau of Labor Statistics (BLS). All data points are the annual averages of the monthly SA (seasonally adjusted) series. See the sidebar for an explanation of U-4 – 6.
SOURCES: BLS/Haver Analytics.
Employed Part Time for Economic Reasons, Population Shares
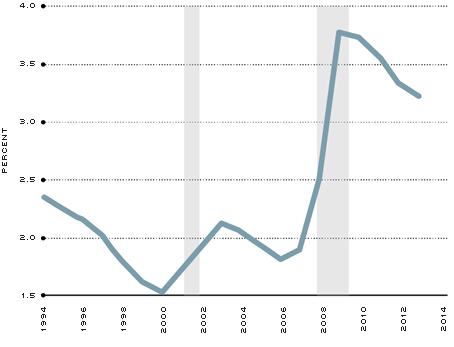
NOTE: The figure shows the number of people employed part time for economic reasons as the share of the civilian noninstitutional working-age population. All data points are annual averages of the monthly NSA (not seasonally adjusted) series. The shaded areas represent recessions.
SOURCES: BLS/Haver Analytics.
Ratio of Employed Part Time for Economic Reasons to Unemployed
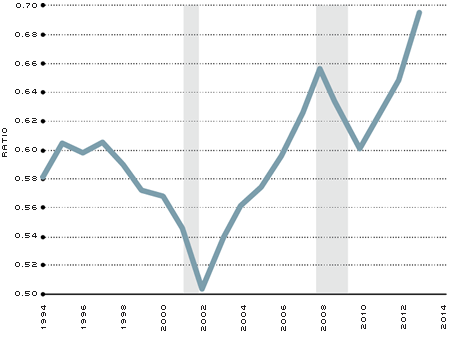
NOTE: The figure shows the ratio of people employed part time for economic reasons to unemployed workers. All data points are the annual averages of the monthly NSA (not seasonally adjusted) series. The shaded areas represent recessions.
SOURCES: BLS/Haver Analytics.
Employed Part Time for Economic Reasons, by Reason
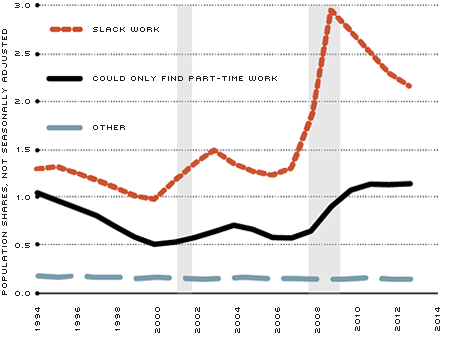
NOTE: The figure shows PTER by reason as share of civilian noninstitutional working-age population. All data points are the annual averages of the monthly NSA (not seasonally adjusted) series. The shaded areas represent recessions. "Other" includes job started/ended during the survey week, as well as seasonal work.
SOURCE: CPS.
Endnotes
- Noneconomic reasons include child care problems, other family/personal obligations, health/medical limitations, school/training, retired/Social Security limit on earnings and full-time workweek is fewer than 35 hours. [back to text]
References
Bregger, John E.; and Haugen, Steven E. "BLS Introduces New Range of Alternative Unemployment Measures," Monthly Labor Review, October 1995, Vol. 118, No. 10, pp. 19-26.
Canon, Maria; Kudlyak, Marianna; and Reed, Marisa. "Not Everyone Who Joins the Ranks of the Employed Was ‘Unemployed.' " Federal Reserve Bank of St. Louis The Regional Economist, January 2014, Vol. 22, No. 1, pp. 14-16.
Polivka, Anne E.; and Rothgeb, Jennifer M. "Overhauling the Current Population Survey: Redesigning the CPS Questionnaire." Monthly Labor Review, September 1993, Vol. 116, No. 10, pp. 10-28.
Sorrentino, Constance. "International Unemployment Rates: How Comparable Are They?" Monthly Labor Review, June 2000, Vol. 123, No. 6, pp. 3-20.
Valletta, Rob; and Bengali, Leila. "What's Behind the Increase in Part-Time Work?" Federal Reserve Bank of San Francisco Economic Letter, August 2013.
Views expressed in Regional Economist are not necessarily those of the St. Louis Fed or Federal Reserve System.
For the latest insights from our economists and other St. Louis Fed experts, visit On the Economy and subscribe.
Email Us
