

Not Everyone Who Joins the Ranks of the Employed Was "Unemployed"
The labor market is comprised of employed and unemployed workers. The former have jobs. The latter do not but are able to work and are actively seeking jobs. In contrast, labor market nonparticipants are neither working nor searching for jobs. Transitions into and out of labor force nonparticipation have been noted in recent studies to aid understanding of labor market dynamics.[1] In particular, the flows between nonparticipation and unemployment have attracted attention in explaining the dynamics of unemployment during the 2007-09 recession and its aftermath. However, the flows between nonparticipation and employment have received considerably less attention.
The number of workers transitioning from nonparticipation to employment is substantial—almost 3.7 million each month on average between 2003 and 2013, according to the Bureau of Labor Statistics.[2] Given this magnitude, this flow's contribution to understanding labor market dynamics is nontrivial.
For this article, we studied the behavior of nonparticipation-to-employment (N-E) flows from January 2003 to August 2013. We first compared aggregate flows from nonparticipation to employment (N-E) with the flows from unemployment to employment (U-E). Importantly, we found that the former was, on average, higher than the latter by a factor of 1.6, that is, N-E flows were on average 60 percent higher than U-E flows.
We then examined the ratio of these flows by occupation and industry. We found that there existed substantial heterogeneity by occupation and industry. For example, workers in services, management and professional occupations were more likely to come from nonparticipation than from unemployment; conversely, the unemployed were more likely to end up with jobs in physically demanding occupations, such as construction, than were the nonparticipants.
Analysis
The gross flow from N-E is the number of individuals who are not in the labor force in one month and are employed in the following month. These people are bypassing the unemployment status. Consequently, nonparticipating workers who become employed are not receiving unemployment benefits or actively searching for jobs in the month preceding the start of their jobs.
For this analysis, we used Current Population Survey (CPS) data. We matched individuals in two consecutive months. To calculate the N-E gross flow, we counted employed workers in the current month who were out of the labor force in the previous month. We did the same for the U-E gross flow, which counts currently employed workers who were unemployed in the previous month.
We found that the ratio of N-E to U-E aggregate flows declined during the 2007-09 recession.[3] (See Figure 1.) The figure also shows that the ratio did not fall below 1, indicating that newly employed workers are more likely to come from nonparticipation than from unemployment even in a slack labor market. (Conversely, a reading below 1 would indicate that newly employed workers are more likely to come from the ranks of the unemployed than from the ranks of labor force nonparticipants.)
Hires from Nonparticipation Relative to Hires from Unemployment
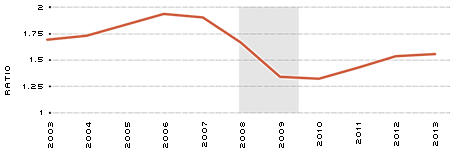
SOURCE: Current Population Survey (CPS).
NOTE: The figure shows the ratio of N-E (nonparticipation to employment) to U-E (unemployment to employment). The data are annual averages of monthly series constructed from matched month-to-month CPS data, January 2003-August 2013. To calculate the N-E gross flow, we counted employed workers in the current month who were out of the labor force in the previous month. We did the same for the U-E gross flow, which counts currently employed workers who were unemployed in the previous month. The gray bar corresponds to a recession period from the peak to the trough in the business cycle.
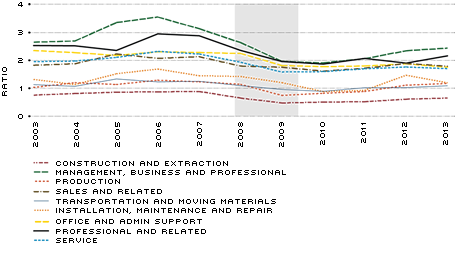
Hires from Nonparticipation Relative to Hires from Unemployment, by Major Occupation
SOURCE: Current Population Survey.
NOTE: See note from Figure 1. The lines display hires from nonparticipation (N-E) divided by hires from unemployment (U-E) within selected occupations. All major occupations are included except armed forces and farming, fishing, and forestry.
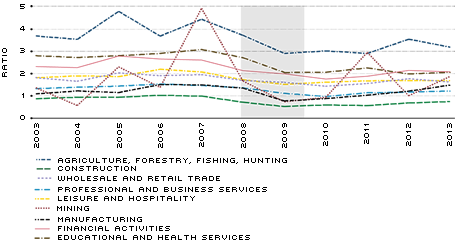
Hires from Nonparticipation Relative to Hires from Unemployment, by Major Industry
SOURCE: Current Population Survey.
NOTE: See note from Figure 1. The lines display hires from nonparticipation (N-E) divided by hires from unemployment (U-E) within selected major industries.
Next, we analyzed the ratio of N-E flows to U-E flows by occupation and industry. (See Figures 2 and 3.) The differences were substantial. Although there was less pronounced cyclicality within each occupation and industry, the ratio of N-E to U-E consistently fell between the end of 2007 and mid-2009 across all sectors.
The ratios within the major occupations formed two distinct patterns. N-E flows were larger in services, management and professional occupations. For example, the average ratio of professional and related occupations was 2.32. This ratio indicates that more than twice as many employed workers in these occupations came from nonparticipation than from unemployment. Physically intensive occupations, such as construction workers and miners, showed the opposite pattern. Workers in construction had an average ratio of 0.68 and theirs was the only occupation to have an average lower than 1, indicating that new construction workers were more likely to come from unemployment than from nonparticipation. This suggests that recent job experience may be more important for these types of jobs.
Heterogeneity also existed across industries. For example, manufacturing had an average monthly ratio of 1.19, while the educational and health services sector had an average monthly ratio of 2.51. The industries with higher ratios had more recent hires from nonparticipation, which could be partly driven by the hiring of recent graduates. Compared with the occupation ratios, the industry ratios of N-E to U-E were more volatile. This volatility shows that there were more differences between their reactions to the same economic conditions. For example, hiring in mining changed more dramatically than in professional and business services, which had a more constant ratio of N-E to U-E flows. This difference suggests that industries had different levels of sensitivity to changes in the economy.
Implications
First, our findings imply that the transitions from nonparticipation to jobs are important in understanding the bigger question of how nonemployed workers find jobs. In particular, the findings put the spotlight on the question of whether there is a conceptual difference between the two nonemployment statuses—unemployment and nonparticipation—in the CPS data.
In the labor literature, there is currently no widely accepted definition of the role of nonparticipation in labor market dynamics. For example, a study by economists Olivier Blanchard and Peter Diamond and one by David Andolfatto and Paul Gomme do not distinguish between unemployment and nonparticipation as separate labor market states in their models. They studied the gross flow as calculated by nonemployment-to-employment, where nonemployment is the sum of nonparticipating and unemployed workers. If nonemployment flows told the entire story of individuals joining employment, we would expect to see a constant ratio of N-E to U-E flows, rather than one that changes with the business cycle.
Because the ratio of N-E flows to U-E flows changes, it is likely that nonparticipation and unemployment describe different populations of nonemployed individuals who react differently to labor market conditions. Another study documented different subgroups coming from nonparticipating workers.[4] The authors suggested the existence of a "waiting" group, whose members are more likely than the rest of the nonparticipants to take a job if wages and conditions are satisfactory. The people in the waiting group are, thus, similar to unemployed workers, though the former do not actively search for work. This difference between nonparticipating workers suggests a high variability of N-E flows in response to business conditions, which is consistent with our findings of a procyclical (moving in the same direction as the economy) pattern in the N-E to U-E ratio in the CPS data.
Second, our findings uncovered heterogeneity by occupation and industry; this difference creates challenges for studies of mismatch between vacancies and job seekers in the economy. When these studies define job seekers, they typically consider only unemployed workers.[5] If the ratio of N-E transitions relative to U-E transitions were the same across all sectors, then omitting the job seekers within the nonparticipating population would not substantially affect the calculation of mismatch indexes. However, since the ratios differ by sector, the difference between indexes using all job seekers and those using only unemployment might be significant.
Consequently, understanding the transitions into jobs from unemployment and from nonparticipation and the differences across sectors will help reveal trends in employment and will help explain how the labor market changes in recessions and recoveries.
Endnotes
- See, for example, Diamond, as well as Kudlyak and Schwartzman. See also references to recent works on the developments in labor force participation in Canon, Debbaut and Kudlyak. [back to text]
- Data available at www.bls.gov/webapps/legacy/cpsflowstab.htm. [back to text]
- For additional analysis, see Canon, Kudlyak and Reed. [back to text]
- See Jones and Riddell. [back to text]
- See Canon, Chen and Marifian. [back to text]
References
Andolfatto, David; and Gomme, Paul. "Unemployment and Economic Welfare." Federal Reserve Bank of Cleveland Economic Review, 1998:Q3, pp. 25-34. See
www.clevelandfed.org/research/review/1998/98-q3-andolfatto.pdf.
Blanchard, Olivier J.; and Diamond, Peter. "The Cyclical Behavior of the Gross Flows of U.S. Workers." Brookings Papers on Economic Activity, 1990, Vol. 21, No. 2, pp. 85-155. See www.brookings.edu/~/media/Projects/BPEA/1990%202/1990b_bpea_blanchard_diamond_hall_murphy.PDF.
Canon, Maria; Chen, Mingyu; and Marifian, Elise A. "Labor Mismatch in the Great Recession: A Review of Indexes Using Recent U.S. Data." Federal Reserve Bank of St. Louis Review, May/June 2013, Vol. 95, No. 3, pp. 237-72. See http://research.stlouisfed.org/publications/review/13/03/237-272Canon.pdf.
Canon, Maria; Debbaut, Peter; and Kudlyak, Marianna. "A Closer Look at the Decline in the Labor Force Participation Rate." Federal Reserve Bank of St. Louis The Regional Economist, October 2013, pp. 10-11. See www.stlouisfed.org/publications/pub_assets/pdf/re/2013/d/labor_force.pdf.
Canon, Maria; Kudlyak, Marianna; and Reed, Marisa. "Finding Jobs from Unemployment versus from Out of Labor Force." 2013, unpublished manuscript.
Diamond, Peter. "Cyclical Unemployment, Structural Unemployment." IMF Economic Review, August 2013, Vol. 61, No. 3, pp. 410-55. See www.palgrave-journals.com/imfer/journal/v61/n3/pdf/imfer201313a.pdf.
Jones, Stephen R.G.; and Riddell, W. Craig. "The Measurement of Unemployment: An Empirical Approach." Econometrica, January 1999, Vol. 67, No. 1, pp. 147-62.
Kudlyak, Marianna; and Schwartzman, Felipe. "Accounting for Unemployment in the Great Recession: Nonparticipation Matters." Federal Reserve Bank of Richmond Working Paper Series, No. 12-04, June 2012. See www.richmondfed.org/publications/research/working_papers/2012/pdf/wp12-04.pdf.
Views expressed in Regional Economist are not necessarily those of the St. Louis Fed or Federal Reserve System.
For the latest insights from our economists and other St. Louis Fed experts, visit On the Economy and subscribe.
Email Us
