


How Important Are Production Networks to the U.S. Economy?
KEY TAKEAWAYS
- As manufacturing grows more sophisticated, industries become more interconnected through production networks.
- By analyzing input-output data, economists can measure the independence and interdependence of U.S. industries in the production of their goods and services.
- Studying production networks can reveal how industries' output growth and job growth are increasingly correlated.
Introduction
The structure of modern industrial production is highly complicated. As the manufacturing process becomes more sophisticated, firms and sectors are increasingly interconnected with each other through production networks.
As a result of these production networks, an economic downturn in one industry (referred to as an industry-specific shock) will be felt by all its industry partners. New research on production networks suggests industry-specific shocks actually account for at least half of the volatility in aggregate growth. See Atalay.
An industry’s final output can be sold directly to consumers or passed down to another industry as an intermediate input for more production. One can view the production network as a river flowing from raw materials down to the final consumer. When an industry is closer to final consumers, we call it a downstream industry; when its production is closer to raw materials, it’s an upstream industry.
Downstream industries are also referred to as buyer industries because they tend to buy more products from a broad swath of upstream industries, while upstream industries are referred to as supplier industries because they mainly supply materials to other industries. Industries can be both downstream and upstream relative to one another. For example, automobile production is a downstream industry for steel manufacturers but an upstream industry for a law firm that purchases vehicles so that its lawyers can meet with clients.
This article aims to outline the production network structure of the U.S. economy by identifying the key industries that are central suppliers and buyers and by exploring the importance of the automotive industry to the U.S. economy during the 2007-09 Great Recession.
Models of Production Networks
Figure 1 displays three simplified theoretical models of production networks that illustrate the importance of one industry to the overall network.
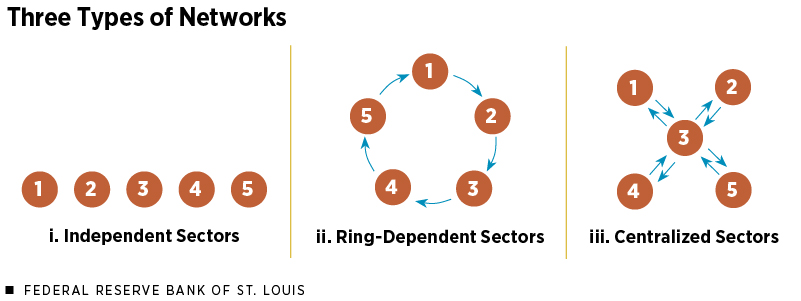
In the first case, all industries operate independently. They produce output with workers and physical capital but do not use inputs from other industries or sell their output to other industries as an input. All output goes directly to final household consumption.
The second case is a network that resembles an O-ring. All industries sell to a single downstream industry and purchase from a single upstream industry. In contrast to the first case, if there is a disruption to industry 1’s manufacturing process, it would affect not only the downstream buyer (industry 2) but also the supplier (industry 5). This case also illustrates how industries can be both upstream and downstream relative to other industries.
The third case is a star-type network. In this case, there is a central hub (industry 3), and the others are peripheral industries. Industry 3 could play a prime role as a buyer (downstream industry) in the economy (e.g., the automobile industry). The auto industry takes various products from other industries, including glass, electronic equipment and steel, then assembles them together to produce a car. Industry 3 could also play a role as a central supplier (upstream industry), such as the oil industry. In either case, if a negative shock occurs to industry 3, it would be transmitted to the rest of the economy. In contrast, a shock to industry 1 would have a contained impact.
U.S. Input-Output Linkages
Input-output tables produced by the Bureau of Economic Analysis (BEA) allow us to study the actual production network of the U.S. economy. Input-output tables quantify how much each industry buys from other industries. They are used by policymakers, economists and business owners to understand the structure of the U.S. economy.
We can construct two measures from the input-output tables to learn about the predominant upstream and downstream industries in the U.S. production network.
One measure is the material cost share, which is found by taking the material costs paid to an upstream industry as a ratio of the gross output of the purchasing industry. The material cost share helps identify which industries are important suppliers, or upstream industries, to several other industries.
For example, for each $100 of output generated by the petroleum refining industry, around $50 is from a commodity purchase from the oil and gas extraction industry. In contrast, less than $5 flows from the petroleum refining industry to the oil and gas extraction industry for each $100 created by the extraction industry.
Analyzing the material cost shares for the U.S. economy reveals that some industries appear to be important suppliers, or upstream industries, for others. For example, many industries rely on the “other services” industry; this industry includes legal services, computer systems design and related services, management of companies and enterprises, food services and drinking places, etc. Other noteworthy upstream or supplier industries are wholesale and retail, F.I.R.E. (finance, insurance and real estate), primary metals, and fabricated metals.
Another measure we can construct from the input-output tables is the output share. This measure takes the output purchased by a downstream industry from an upstream industry and divides it by the upstream industry’s total output.
The output share gives information on which industries are predominant purchasers, or downstream industries. For example, if industry A produces $100 and industry B purchases $50 from industry A, the output share measure is 0.5 from A to B. In the case of the earlier example, the output share from the oil and gas extraction industry to the petroleum refining industry is 0.82, meaning that the petroleum refining industry purchases $82 of each $100 produced by the oil and gas extraction industry.
Fewer industries stand out as predominant buyers than those that stand out as predominant suppliers. The industries that stand out as large buyers are construction, motor vehicles (auto industry), other services and government. Of course, here we have ignored the main buyer of the economy—households. We do not consider them within the input-output framework since they mainly provide labor to the economy.
The measures constructed from the input-output tables help us draw a few conclusions about U.S. production networks. First, industries tend to rely heavily on outputs from firms within the same industry. Second, there are a few dominant upstream (supplier) industries that stand out, while the downstream output share (purchasing) appears to be more evenly spread across many industries.
Measures of Interdependence and Independence
The previous section focused on industry-to-industry flow, looking at the entire web of the production network. In this section, we quantify an industry’s degree of integration with the rest of the economy by using two aggregated summary measures.
The first measure is called “in-degree” and is calculated as the ratio of an industry’s total material costs over total final output (or total revenue). A high in-degree value implies that the industry is more reliant on using intermediate inputs for production.
In the left panel of Figure 2, we plot a histogram of in-degrees for the U.S. production network, which is divided into 71 industries. The distribution of in-degrees is a bell curve, centered on the mean of 0.44. It implies that, on average, 44 percent of an industry’s revenue is used to pay for the inputs purchased from upstream industries.
The range of in-degree distribution is small. The industry at the 75th percentile has an in-degree value 1.7 times larger than the industry at the 25th percentile. The apparel, leather and allied products industry has the highest in-degree value, at 0.75, followed by the motor vehicles, bodies and trailers, and parts industry.
Next, we evaluate an industry’s importance as an intermediate input supplier for the whole economy by using a measure called “out-degree.” An industry’s out-degree is calculated by determining the output share of downstream purchasers’ material inputs that come from that industry, and then taking a sum over all the downstream industries.
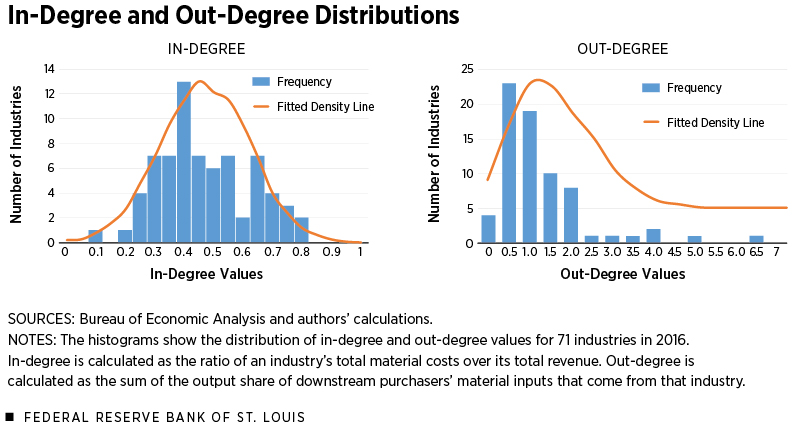
For example, if industry A sells its outputs only to three other industries and these three industries use only the materials from industry A, then industry A’s out-degree value is 3. A higher out-degree means that an industry has many downstream purchasers that are highly dependent on material inputs from it.
We plot the distribution of out-degrees in the right panel of Figure 2. We see that many industries’ out-degree values are centered on 1, with a few outliers in the right tail of distribution. The outliers are mostly service-based industries, like professional, scientific and technical services, real estate, and management. The outliers are not surprising for out-degrees, as all industries have to employ certain services to operate. For example, every industry requires lawyers to assist with the legality of business operations.
The range of the out-degree distribution is much wider than that of the in-degrees. The ratio of the 75th percentile industry to 25th percentile industry is 6.4. These numbers suggest that the distribution of upstream suppliers (out-degrees) is more dispersed than the distribution of downstream buyers (in-degrees).
This section tells us that a lot of industries in the U.S. rely on intermediate goods for production; however, on the supply side, there are several industries that are smaller suppliers and a few industries that are dominant suppliers.
Comovement of Linked Industries
So far, we have looked at how industries are connected to the supply chain from a stationary perspective. Another useful perspective is to understand how the degree of connection in the input-output network determines the dynamics of industry output and employment. One would expect that if two industries are closely connected in the input-output network, there should be a strong comovement in the industries’ output and employment.
We examine two measures for industry output—gross output and value added. The BEA defines gross output of an industry as the market value of that industry’s production in terms of goods and services. The BEA’s definition of gross output can be found at https://www.bea.gov/help/faq/183.
Value added is the way the BEA measures gross domestic product (GDP). It’s a measure of the amount of output from an industry that could be attributed to only the labor and physical capital used to process the intermediate inputs during production. The value added of an industry is also the contribution of a private industry to overall GDP. A simple way to think of value added is that it’s the difference between an industry’s gross output and the cost of its intermediate inputs. The BEA’s definition of industry value added can be found at https://www.bea.gov/help/faq/184.
As an additional measure of industry dynamics, we look at industry payroll employment growth as well. For more details on payroll employment and its survey source (Current Employment Statistics survey), see www.bls.gov/web/empsit/cesfaq.htm.
To measure the closeness of two industries, we calculate the share of intermediate materials by taking the amount of materials exchanged between two industries and then dividing it by the total output from the two industries. This calculation is essentially an output-weighted average of the material shares between the two industries. For example, the material share from oil and gas extraction to petroleum refining is 0.5, and the reverse from petroleum refining to oil and gas extraction is 0.05. After weighting the material shares by each industry’s output, the closeness measure is then 0.275.
Then we organize each industry pair into quintiles based on the intermediate material share. Next, we find the correlation of each industry pair’s gross output, value added and employment growth over time, and finally take the average of the correlation coefficient for each group of industry pairs. The resulting data are presented in Figure 3.
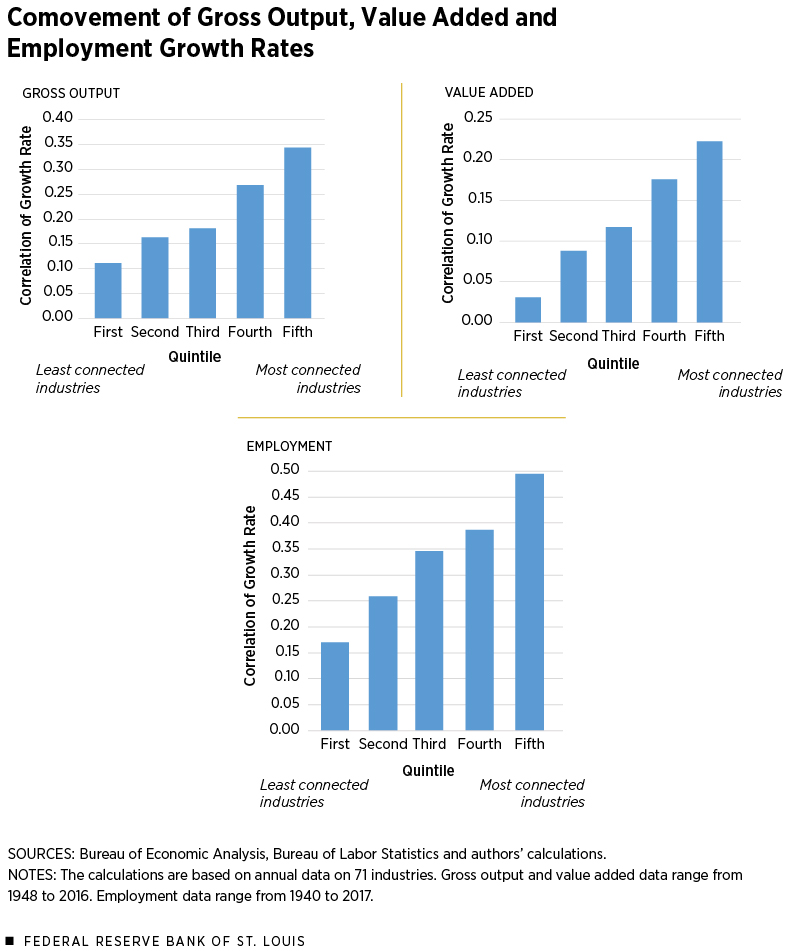
Essentially, we have five industry groups that are organized from least connected (first quintile) to most connected (fifth quintile) and a correlation coefficient for each industry group that shows, on average, how the industries in each group move together. From the graphs, we see that the correlation between industries’ output and employment growth increases as the linkage between industries becomes stronger. This pattern follows our observation that economic activity of one industry likely passes through to its related industries.
Case Study: The Auto Industry
One of the key industries in the U.S. economy is the motor vehicles, bodies and trailers, and parts manufacturing industry, which we’ll refer to as the auto industry. The importance of the auto industry to the U.S. economy was brought to the forefront of policy discussions during the 2007-09 recession.
A combination of high fuel costs, a product concentration on fuel-inefficient SUVs and the onset of a recession left U.S. automakers Chrysler and General Motors (GM) asking the government for help in 2008 as the two companies faced the prospect of bankruptcy. The third U.S. automobile manufacturer, Ford, did not need a bailout but still advocated for the government to bail out its competitors. The following quote is from the congressional testimony of Ford’s then-CEO Alan Mulally in 2008:
“Should one of the other domestic companies declare bankruptcy, the effect on Ford’s production operations would be felt within days—if not hours. Suppliers could not get financing and would stop shipments to customers. ”See Carvalho, p. 24.
Mulally was referring to the highly interconnected nature of the auto industry. If Chrysler or GM were to go out of business, the upstream industries Ford relies on for inputs would also fail, leading to a complete disruption of Ford’s production. Terms like “too big to fail” surfaced during the 2007-09 crisis to describe the phenomenon of these large, interconnected firms. A firm that is too big to fail is one that is a key hub to the U.S. production network. Its failure would be felt throughout the economy.
We can quantify the size of the auto industry in the U.S. production network by using the metrics we’ve already explored. The industry has one of the highest in-degree values, meaning it largely relies on intermediate inputs for production. With the exception of apparel and leather production, the auto industry has the highest in-degree value for the U.S. economy, with 75 percent of output going to pay for intermediate materials. The auto industry purchases a large amount of inputs from the other services, wholesale and retail, metals manufacturing, and nonelectrical machinery manufacturing industries.
The auto industry doesn’t have a large out-degree relative to the rest of the economy, likely because most of the industry’s finished products go directly to consumers. However, there are industries in the manufacturing sector—such as metals, textiles, and rubber/plastics—that purchase inputs from the auto industry. These downstream industries would be impacted by a negative shock also.
Using the 2007-09 recession as an example of a negative shock, Figure 4 shows the interconnected nature of the production network surrounding the auto industry.
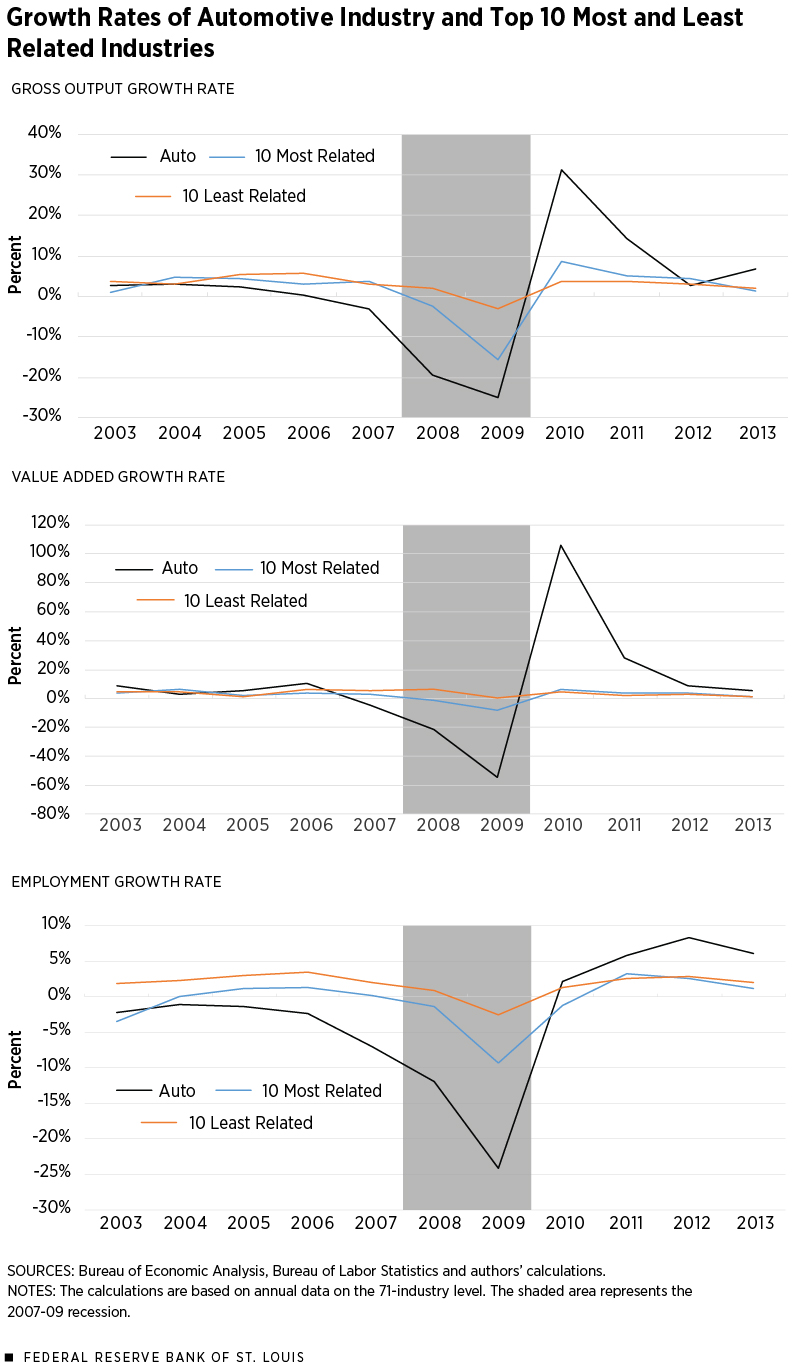
While the 2007-09 recession was not necessarily a shock to the auto industry alone, the auto industry was one of the hardest hit by the recession. A deadly combination of decreased consumer demand for vehicles and tighter lending practices that made it hard for consumers to get financing hurt automakers worldwide. High gas prices leading into the recession had already decreased demand for larger vehicles, making the downturn especially fatal for U.S. automakers.
If the 2007-09 recession was felt equally across the economy, we would see that all industries move similarly. Rather, comparing output patterns for the auto industry and other industries closely and not closely tied to it, we see that not all industries were impacted to the same degree.
The black lines show the year-over-year growth rate of gross output, value added and employment for the auto industry from 2003 to 2013. The gray bar highlights the time period when the U.S. economy was in recession. The blue and orange lines show the average growth rates for the auto industry’s 10 most and least related industries based on material cost share.
In each graph, we see that the black line drops during the 2007-09 recession and rebounds immediately following the recession. The blue line, which represents the auto industry’s top 10 suppliers, also shows a sharp drop followed by a resurgence in the gross output and employment growth graphs, and the same pattern—but slightly softer—in the value added graph. The orange line does not share the same degree of comovement as the black and blue lines. This line represents the growth rates of the 10 industries least related to the auto industry.
These graphs highlight the importance of the network structure of the U.S. economy. The auto industry is a central hub for many upstream suppliers, and any shock to the auto industry will be felt far beyond the industry itself. However, industries that are relatively isolated from the auto industry won’t experience as much turmoil.
Conclusions
In this article, we explored U.S. production networks. The production network is a complex subject that still needs greater understanding. To quantify the impact of one industry on the whole economy, economists need more theories and empirical evidence.
We showed that the U.S. economy is characterized as a centralized economy, in which a number of key industries buy and supply most of the materials in the economy. While many industries are large buyers, there are fewer large suppliers. Some of the central supplier and buying industries, like wholesale trade, also tend to be large in terms of economic output in the economy.
These linkages are important for understanding industry dynamics. As industries are increasingly dependent on each other, their output growth and employment growth are increasingly correlated. This dependency is true for both input and output relationships.
Endnotes
- See Atalay.
- Of course, here we have ignored the main buyer of the economy—households. We do not consider them within the input-output framework since they mainly provide labor to the economy.
- The BEA’s definition of gross output can be found at www.bea.gov/help/faq/183.
- The BEA’s definition of industry value added can be found at www.bea.gov/help/faq/184.
- For more details on payroll employment and its survey source (Current Employment Statistics survey), see www.bls.gov/web/empsit/cesfaq.htm.
- See Carvalho, p. 24.
References
Atalay, Enghin. How Important Are Sectoral Shocks? American Economic Journal: Macroeconomics, October 2017, Vol. 9, No. 4, pp. 254-280. See https://doi.org/10.1257/mac.20160353.
Carvalho, Vasco M. From Micro to Macro via Production Networks. Journal of Economic Perspectives, Fall 2014, Vol. 28, No. 4, pp. 23-48. See https://pubs.aeaweb.org/doi/pdfplus/10.1257/jep.28.4.23.


Views expressed in Regional Economist are not necessarily those of the St. Louis Fed or Federal Reserve System.
For the latest insights from our economists and other St. Louis Fed experts, visit On the Economy and subscribe.
Email Us