

Housing Crash Continues to Overshadow Young Families' Balance Sheets
The average young family - which we define as a single- or multi-person family unit headed by someone under 40 - has recovered only about one-third of the wealth it lost during the financial crisis and recession. The average wealth of middle-aged families (ages 40 to 61) and older families (ages 62 or older) has recovered to about its precrisis level.
The main reason young families' balance-sheet recovery lags is the recent housing crash and its lingering effects. The homeownership rate among younger families has plunged, reflecting both the loss of many homes through foreclosure or other distressed sales and delayed entry into homeownership among newly formed households. The house-price gains that have helped mainly older families to rebuild homeowners' equity have been overshadowed among younger families by the ongoing retreat from homeownership.
Young Families' Wealth Remains Far below the Precrisis Level
The average inflation-adjusted (real) wealth of a young family was about $108,000 at the end of the third quarter of 2013, based on our estimates.[1] The average real wealth of a family headed by someone between 40 and 61 was about $691,000, while the average real wealth of a family headed by someone aged 62 or older was about $928,000.[2] Figure 1 displays the average wealth for families in each age category at three-year intervals beginning in 1989, when our data begin.
To more easily compare percentage changes over time, Figure 2 re-scales the level of average real net worth for families in each age group to equal 100 in 2007. The very large percentage decline in average wealth among young families between 2007 and 2010 is clear in Figure 2.[3] Column 1 of Table 1 reports the percentage declines for each age group between 2007 and 2010. Column 2 of Table 1 shows that the average wealth of young families actually recovered a bit faster between 2010 and the third quarter of 2013 than it did among middle-aged and older families, according to our estimates.
Column 3 of Table 1 displays the net change in average real wealth since 2007. Despite a notable recovery since 2010, the average wealth of young families remains some 30 percent below its 2007 level. The two older age groups have, on average, recovered to about their respective 2007 levels.
Column 4 of Table 1 shows that the average real wealth among young families at the end of the third quarter of 2013 remained below its 1989 level - a period of 24 years. In contrast, the average wealth of middle-aged families was about two-thirds higher than its 1989 level and the average wealth of an older family has almost doubled since 1989.
What's Behind the Slow Wealth Recovery of Young Families?
Recessions …
Figures 1 and 2 suggest that young families' wealth is especially sensitive to recessions. These figures span three U.S. recessions, which occurred in 1990-91, 2001 and 2007-08. The average real wealth of all age groups declined between 1989 and 1992 and again between 2007 and 2010.
In both cases, the average wealth of young families declined more steeply than that of other groups. While the middle-aged and older groups' average wealth did not decline during any three-year period between 1992 and 2007, young families' wealth did decline between 2001 and 2004. Thus, young families' wealth is more sensitive to recessions than the wealth of middle-aged and older families, on average.
… and Real Estate
The primary cause of lagging wealth recovery in recent years among young families appears to be the massive decline in the value of residential real estate (owner-occupied housing).[4] Figure 3 traces the evolution of the average value of residential real estate among the three age groups. To highlight developments since 2007, the level of housing assets for each age group was set equal to 100 at its respective 2007 level. One notable feature evident in Figure 3 is the similarity across age groups in the period-to-period percentage changes - both negative and positive - in the average value of real housing assets between 1989 and 2007. The average real value of young families' housing assets declined a bit more in percentage terms between 1989 and 1995 than for the other groups, but the difference is relatively minor.
This pattern changed dramatically after 2007. While middle-aged and older families have experienced notable recoveries after their own significant declines, the average value of housing on young families' balance sheets remains about 35 percent below its 2007 level.
Young Families Lead a Retreat from Homeownership
After peaking in 2004 at 69.0 percent, the national homeownership rate has fallen nine consecutive years, reaching 65.1 percent in 2013.[5] Figure 4 shows that the homeownership rate first surpassed this level in 1979, some 34 years ago. The homeownership rate is not declining because the number of owner-occupiers is falling; in fact, their number has increased by about 0.4 million since 2004. But this represents a tiny fraction - about 5.6 percent - of the net new households that have formed since 2004 (numbering about 7.1 million); the rest have become renters.
Below the surface appearance of a roughly constant number of homeowners since 2004 lie complex movements of families choosing between renting and homeownership. Recent Census data show that young and, to a lesser extent, middle-aged families are leading a retreat from homeownership. Only the very oldest families, headed by someone aged 75 or older, are more likely to be homeowners now than before the recession.
Homeownership Rates by Age
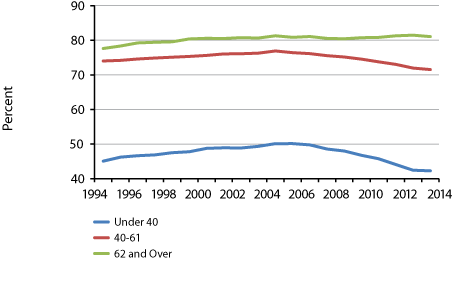
Figure 5 displays homeownership rates between 1994 and 2013 for young families (headed by someone under 40), middle-aged families (headed by someone between 40 and 61 years old) and older families (headed by someone 62 or older). Homeownership rates increased among all three groups until the middle of the last decade.
As the housing crash unfolded, the homeownership rate among young families decreased rapidly, from 50.1 percent in 2005 to 42.2 percent in 2013. Middle-aged families' homeownership rate declined from 76.9 percent in 2005 to 72.1 percent in 2013. While striking, this nearly 5 percentage point decline is notably smaller than the nearly 8 percentage point decline among young families. In sharp contrast, older families actually increased their homeownership rate after 2005 by almost a full percentage point.[6]
Homeownership Rates by Birth-Year Cohort
Table 2 displays movements in age-specific homeownership rates by various birth-year cohorts reported by the Census Bureau at five points during the last 20 years (1993, 1998, 2003, 2008 and 2013). The table allows tracking both of household groups born during a certain period - in particular, five-year birth cohorts - and of the evolution of homeownership rates of different groups of households as they pass through a certain age range - a life-cycle perspective. The table also includes the average homeownership rate observed for each age group during the 2004-06 period, when the housing boom and homeownership rate reached their peaks.
One conclusion we draw from Table 2 is that homeownership rates generally increase for a given cohort as they age. (To see this, read down any column.) The exceptions to this rule are that homeownership rates generally fall after age 75 and that the most recent observation in each column (corresponding to 2013) is lower than the one right above it (corresponding to 2008) for most cohorts. This is evidence that the housing crash affected virtually all age groups to some extent.
Table 2 also shows that successive (that is, later-born) cohorts generally had higher homeownership rates than earlier-born cohorts during the early part of the sample (1993, 1998 and 2003).[7] Falling homeownership rates at a given life-cycle stage in 2008 and 2013 reflect the housing crash. (To see this, read across any row.)
Young Families Have Had the Largest Declines in Homeownership Rates
Table 3 transforms the homeownership data by subtracting the 2004-06 average homeownership rate for each age range from the annual observations. The table shows that homeownership rates fluctuated the most from their peak levels in young and middle-aged groups. For example, the homeownership rate in the 35-39 age group increased 5.9 percentage points between 1993 (when we observe the 1954-58 cohort) and 2004-06 before falling 11.0 percentage points by 2013 (when we observe the 1974-78 cohort).
Comparing specific cohorts through time - that is, reading down the columns - the groups with the largest fluctuations in homeownership rates relative to the life-cycle pattern evident at the peak (2004-06) were those born in 1969-73, 1974-78 and 1979-83. The 1974-78 cohort, for example, had a homeownership rate of 55.4 percent in 2013, when they were in the 35-39 age range. This was a huge 11.0 percentage points lower than the 66.4 percent observed among families that were 35 to 39 years old at the peak of the housing boom.
As the tables show, families headed by someone between the ages of 24 and 38 in 2007 (i.e., born between 1969 and 1983) experienced the largest declines in homeownership rates from peak levels for their stage in the life cycle. By this measure, young families clearly felt the greatest impact of the housing crash.
Families that were middle-aged at the beginning of the housing crash - primarily Baby Boomers - have also experienced a notable decline in homeownership rates, albeit less steep than among young families. For example, families headed by someone born between 1959 and 1963 (i.e., aged 44 to 48 in 2007) had a homeownership rate of 72.8 percent in 2013, which was 5.2 percentage points lower than the rate experienced by families of a similar age at the peak of the housing boom.
Older families experienced much smaller declines in homeownership rates or even increased them. For example, families headed by someone born between 1939 and 1943 had a homeownership rate of 82.8 percent in 2013, which was only marginally (0.3 percentage points) below the homeownership rate among families of a similar age during the peak period. Even more striking, families headed by someone born between 1934 and 1938 had a homeownership rate of 79.8 percent in 2013 (when they were 75-79 years old), which was 1 percentage point higher than the rate for all families headed by someone 75 years or older at the peak.
The Homeownership Rate Is Unlikely to Return to Its Peak Level Soon
As of 2013, the homeownership rate appeared to be in continuing decline among young and middle-aged families. It is reasonable to expect that, at some point, the homeownership rate will stabilize for both groups and for the population as a whole. Yet, the sharp declines in homeownership rates experienced among non-elderly families in recent years suggest that the typical pattern of increasing homeownership rates over the life cycle may trace out a lower trajectory than evident at the housing peak. For example, the 2013 homeownership rates among families headed by someone 25-29 was 6.5 percentage points lower than at the peak, while families headed by someone 30-34 had a homeownership rate in 2013 that was 8.3 percentage points lower than at the peak. The result of lower homeownership rates at every stage in the life cycle would, of course, translate into a lower homeownership rate overall. This seems likely because the 2004-06 period likely represented unusual conditions in housing and mortgage markets that we will never see again. Thus, it appears unlikely that the overall homeownership rate will return to its peak level any time soon, if ever.
Average Real Net Worth by Age of Family Head
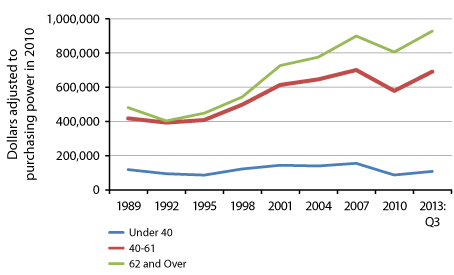
SOURCES: Federal Reserve Board's Survey of Consumer Finances, for all years between 1989 and 2010; our estimates for 2013:Q3.
Evolution of Average Real Net Worth Relative to 2007 Level by Age of Family Head
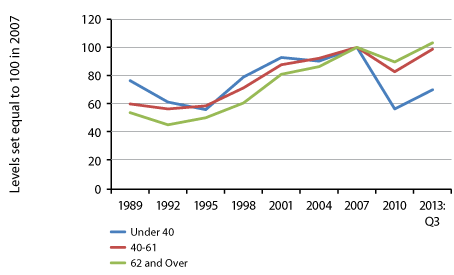
SOURCES: Federal Reserve Board's, Survey of Consumer Finances, for all years between 1989 and 2010; our estimates for 2013:Q3.
Evolution of Average Real Housing Assets Relative to 2007 Level by Age of Family Head
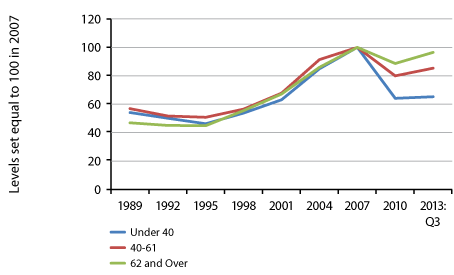
SOURCES: Federal Reserve Board's Survey of Consumer Finances for all years between 1989 and 2010; our estimates for 2013:Q3.
U.S. Homeownership Rate
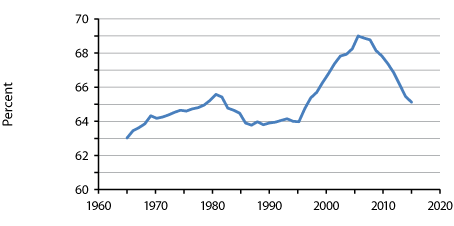
SOURCE: U.S. Census Bureau's Current Population Survey.
Homeownership Rate by Age of Family Head
SOURCES: U.S. Census Bureau's Current Population Survey; our estimates.
Endnotes
- All figures are expressed in terms of purchasing power in 2010. There are advantages and disadvantages associated with using means (or averages) and medians (or exact middles of the distributions), but we report only means here because it is impossible to determine medians using our estimation methodology. For a description of family wealth trends through 2010 that includes both means and medians, see Emmons and Noeth (2012). [back to text]
- The estimates reported here are designed to be comparable to the data reported in the Federal Reserve Board's Survey of Consumer Finances (SCF). The SCF provides detailed balance-sheet information every three years for a representative sample of U.S. families beginning in 1989, with the latest data collected in 2010. [back to text]
- We are comparing the average of families headed by someone under 40 in 2010 to the average of families headed by someone under 40 in 2013, and similarly when we discuss earlier years. The identities of the families in an age group change over time as some move into the middle-aged group and new young families are formed. Thus, we are examining groups of families experiencing certain life-cycle stages, rather than a fixed group of families over time as they age. When we discuss homeownership rates, we will follow particular groups of families over time - that is, we employ a cohort analysis to isolate effects on discrete groups of households. [back to text]
- Emmons and Noeth (2013a) document the significant role of homeownership in the large wealth declines suffered by young families between 2007 and 2010. [back to text]
- U.S. Census Bureau, Current Population Survey. [back to text]
- One possible explanation for the rising homeownership rate among older families is that some of the families that might have planned previously to sell their homes to move to retirement homes or with family delayed selling in hopes that house prices would rebound. [back to text]
- The first observation in each row was made in 1993; the second, in 1998; the third, in 2003; the fourth, in 2008; and the fifth, in 2013. [back to text]
References
Emmons, William R.; and Noeth, Bryan J. "Household Financial Stability: Who Suffered the Most from the Crisis?" Federal Reserve Bank of St. Louis The Regional Economist, July 2012.
Emmons, William R.; and Noeth, Bryan J. "Why Did Young Families Lose So Much Wealth During the Crisis? The Role of Homeownership." Federal Reserve Bank of St. Louis Review, January-February 2013a.
Emmons, William R.; and Noeth, Bryan J. "Economic Vulnerability and Financial Fragility." Federal Reserve Bank of St. Louis Review, September-October 2013b.

In the Balance are short essays related to research on understanding and strengthening the balance sheets of American households. Views expressed are not necessarily those of the St. Louis Fed or Federal Reserve System.
Email Us
