


The Impact of COVID-19 on Labor Markets across the U.S.
The coronavirus pandemic is sending shock waves through labor markets in the U.S. and the rest of the world. In recent weeks, more than 16 million U.S. workers applied for unemployment insurance, an unprecedented figure compared with historical standards. As striking as this figure is, initial claims will likely continue to show large numbers in the coming weeks.
The disruption in labor markets is a result of increased social distance and many other restrictions on the daily activities of individuals, which have crippled many businesses, particularly those that involve direct contact with customers or clients, like the leisure and hospitality sector. In a recent Economic Synopses essay, St. Louis Fed Economist Serdar Birinci and Research Associate Aaron Amburgey showed that U.S. states with a larger concentration of employment in the service sector are also states with a larger increase in unemployment insurance claims.
In this blog post, I study whether areas that have been more severely impacted by the virus, in terms of the number of deaths, have also been more impacted economically, in terms of employment loss.
Impact across U.S. Commuting Zones
Total COVID-19 Deaths per Million People across U.S. Commuting Zones
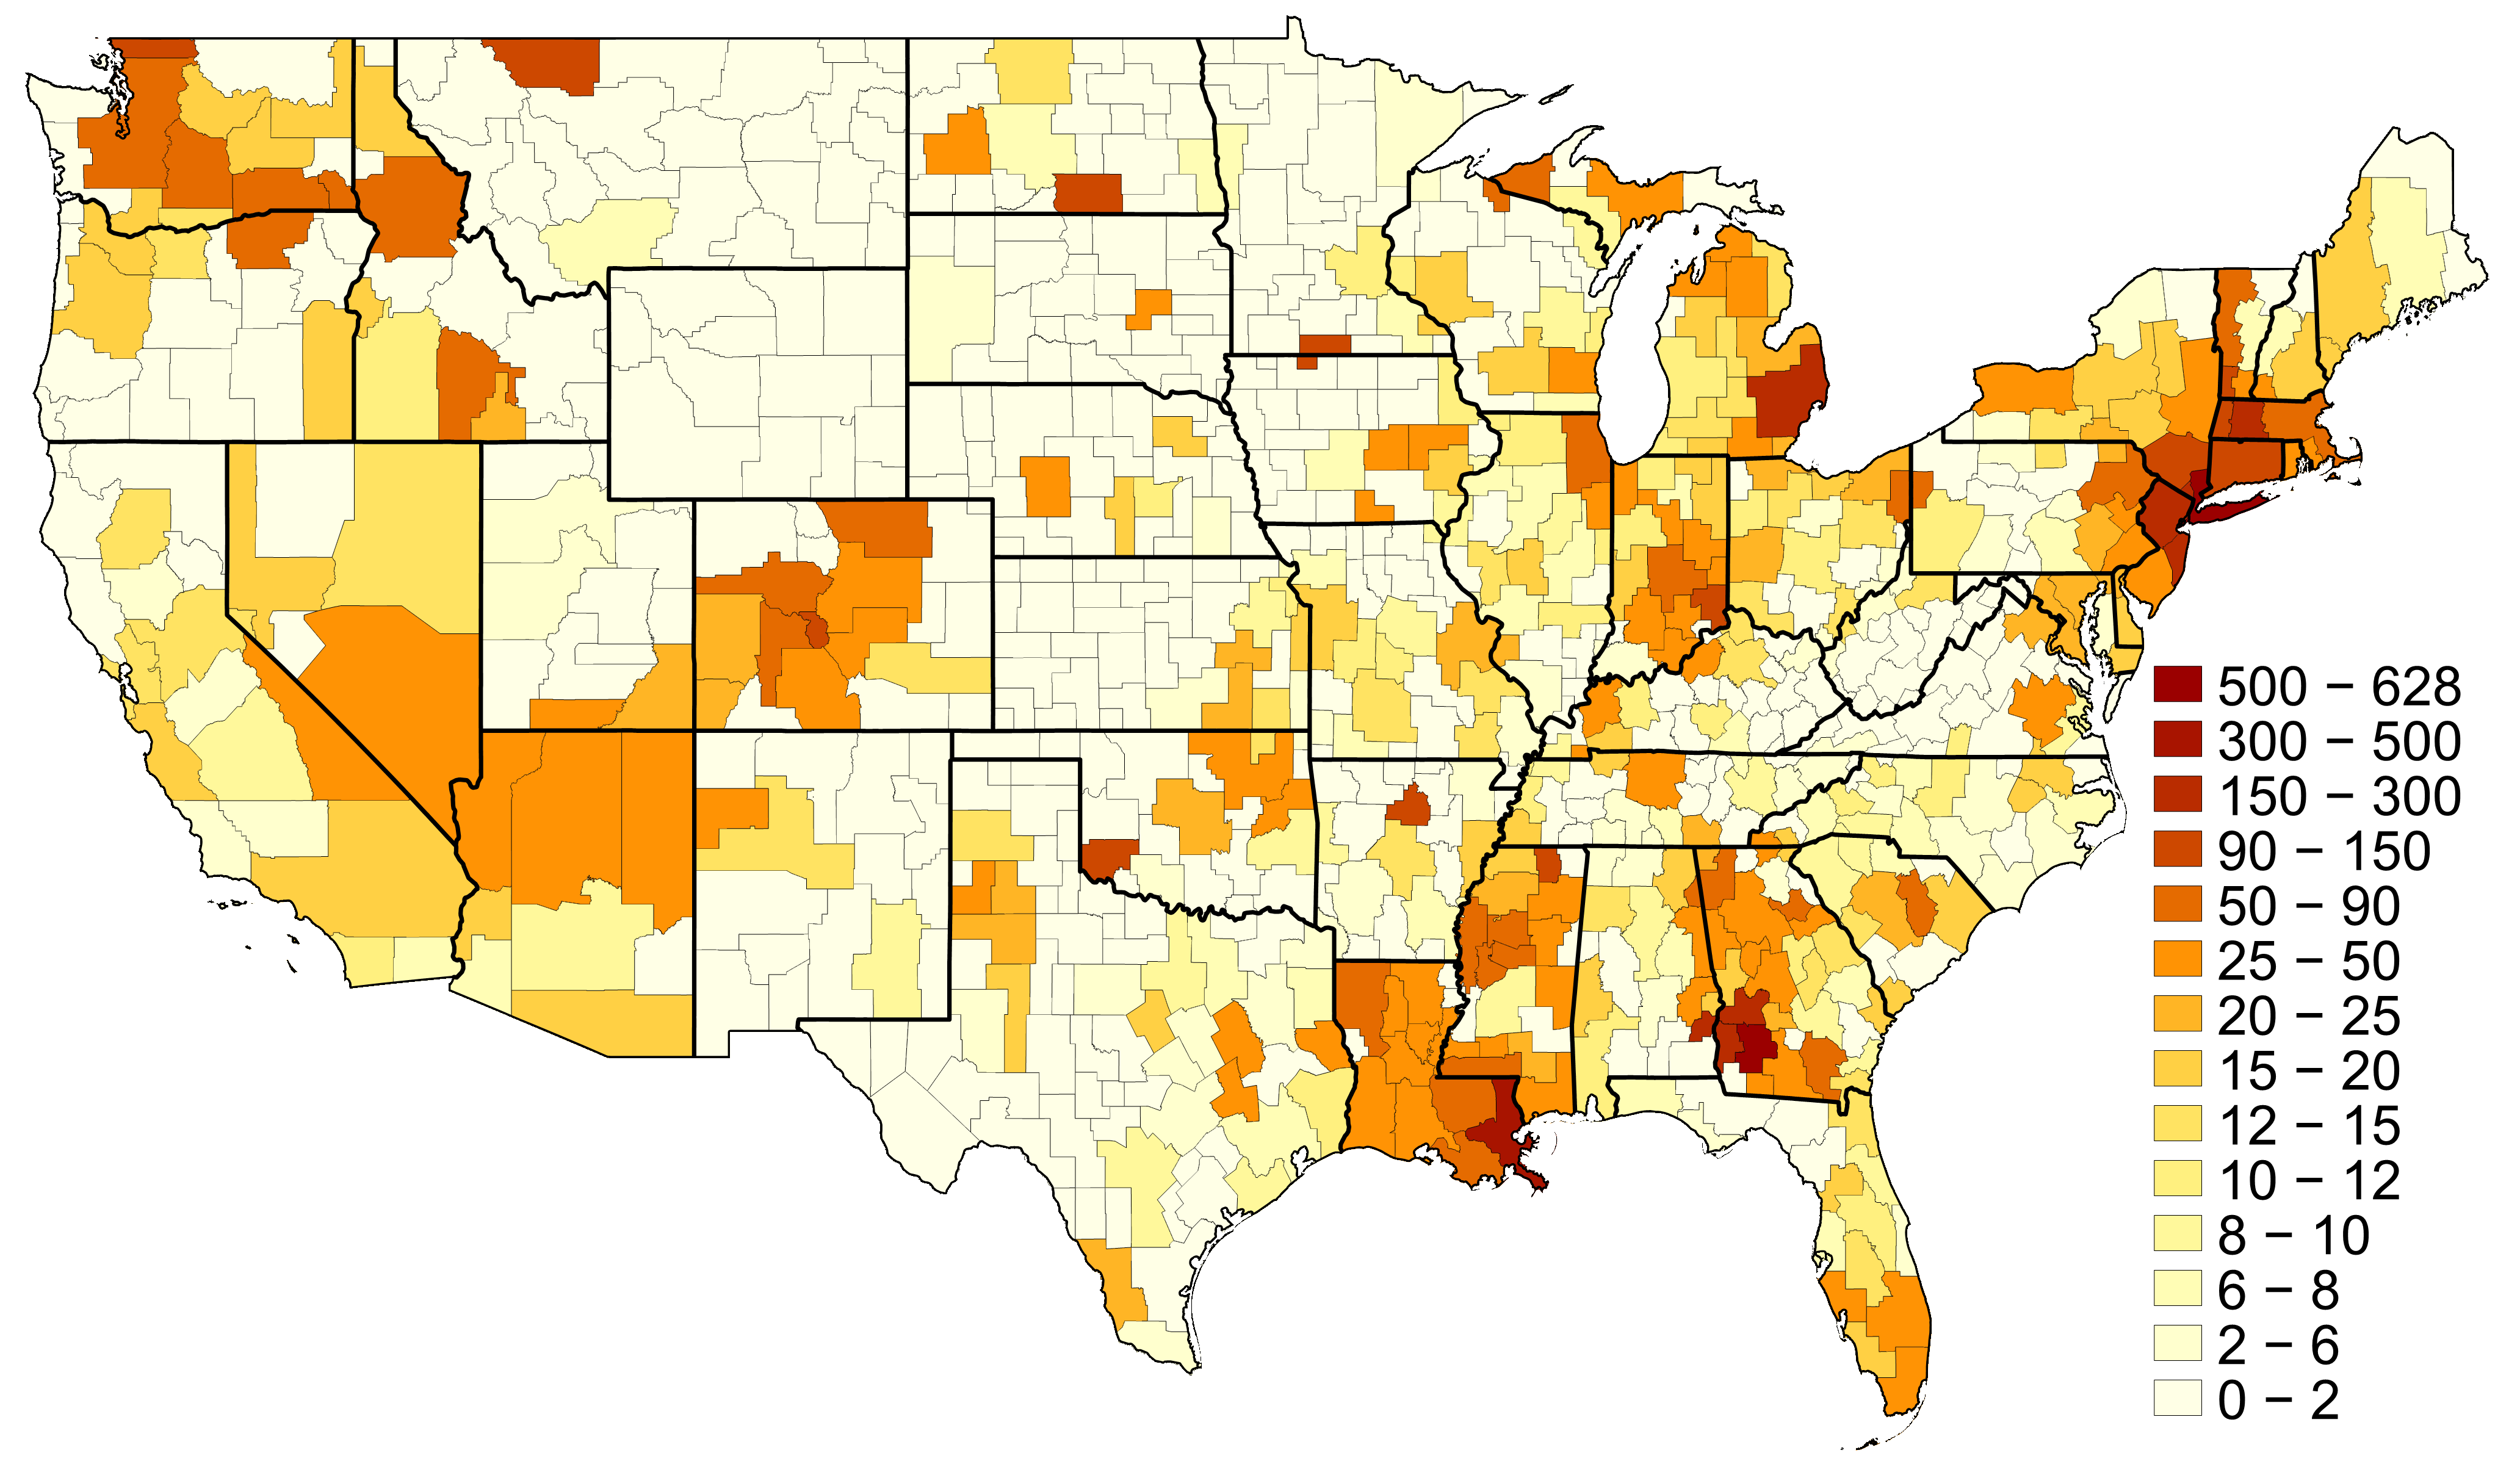
NOTES: A commuting zone is a geographic unit that combines counties into an area that reflects the concept of a local labor market better than a metropolitan statistical area does. The map was constructed using reported deaths by county through April 9, 2020.
SOURCES: USAFacts.org, Census Bureau and author’s calculations.
The map above shows the impact of COVID-19 across different geographic areas of the United States. Since the virus transmits mostly via direct interaction with infected individuals, it is likely that geographic proximity plays an important role in terms of the speed of the transmission and the severity of the contagion and number of cases. Each depicted area in the map displays a commuting zone. These are areas typically larger than a county that define a local labor market, with most individuals living and working inside an area. The map shows the number of COVID-19 deaths per million people through April 9.
In the map, we can see substantial heterogeneity in the relative number of deaths across commuting zones. In particular, New York, Newark, New Orleans, Detroit and Seattle, together with many commuting zones in New England, are areas with a large population and with a large number of deaths per million people. In addition, there are many smaller commuting zones, in terms of population, with a large number of deaths per million people, such as some areas in Colorado (the city of Salida) and Georgia (the city of Albany). At the moment, the total number of deaths per million people is very low in most commuting zones, with more that 50% of all these areas reporting no COVID-19 deaths as of April 9.
Health Conditions and the Labor Market
To what extent is the severity in health conditions also connected to the deterioration of labor markets? To answer this question, I used data on initial claims for unemployment insurance by state for the reporting weeks ended March 21, March 28 and April 4, 2020, adding these three values together. I used the most recent state-level data from the U.S. Department of Labor. These data are not seasonally adjusted I then divided this number by the state’s population to make states with different sizes more comparable.
The figure below plots information on initial claims as a share of population and the number of COVID-19 deaths per million people in the states.I excluded the state of New York, which has a much larger number of COVID-19 deaths relative to the rest, at 360 deaths per million, making it a potential outlier. The figure suggests that there is a positive correlation between the severity of the health crisis and the severity of the economic crisis. Those states with a larger number of deaths per million also tend to be states with relatively more initial unemployment insurance claims.
COVID-19 Deaths and Initial Jobless Claims
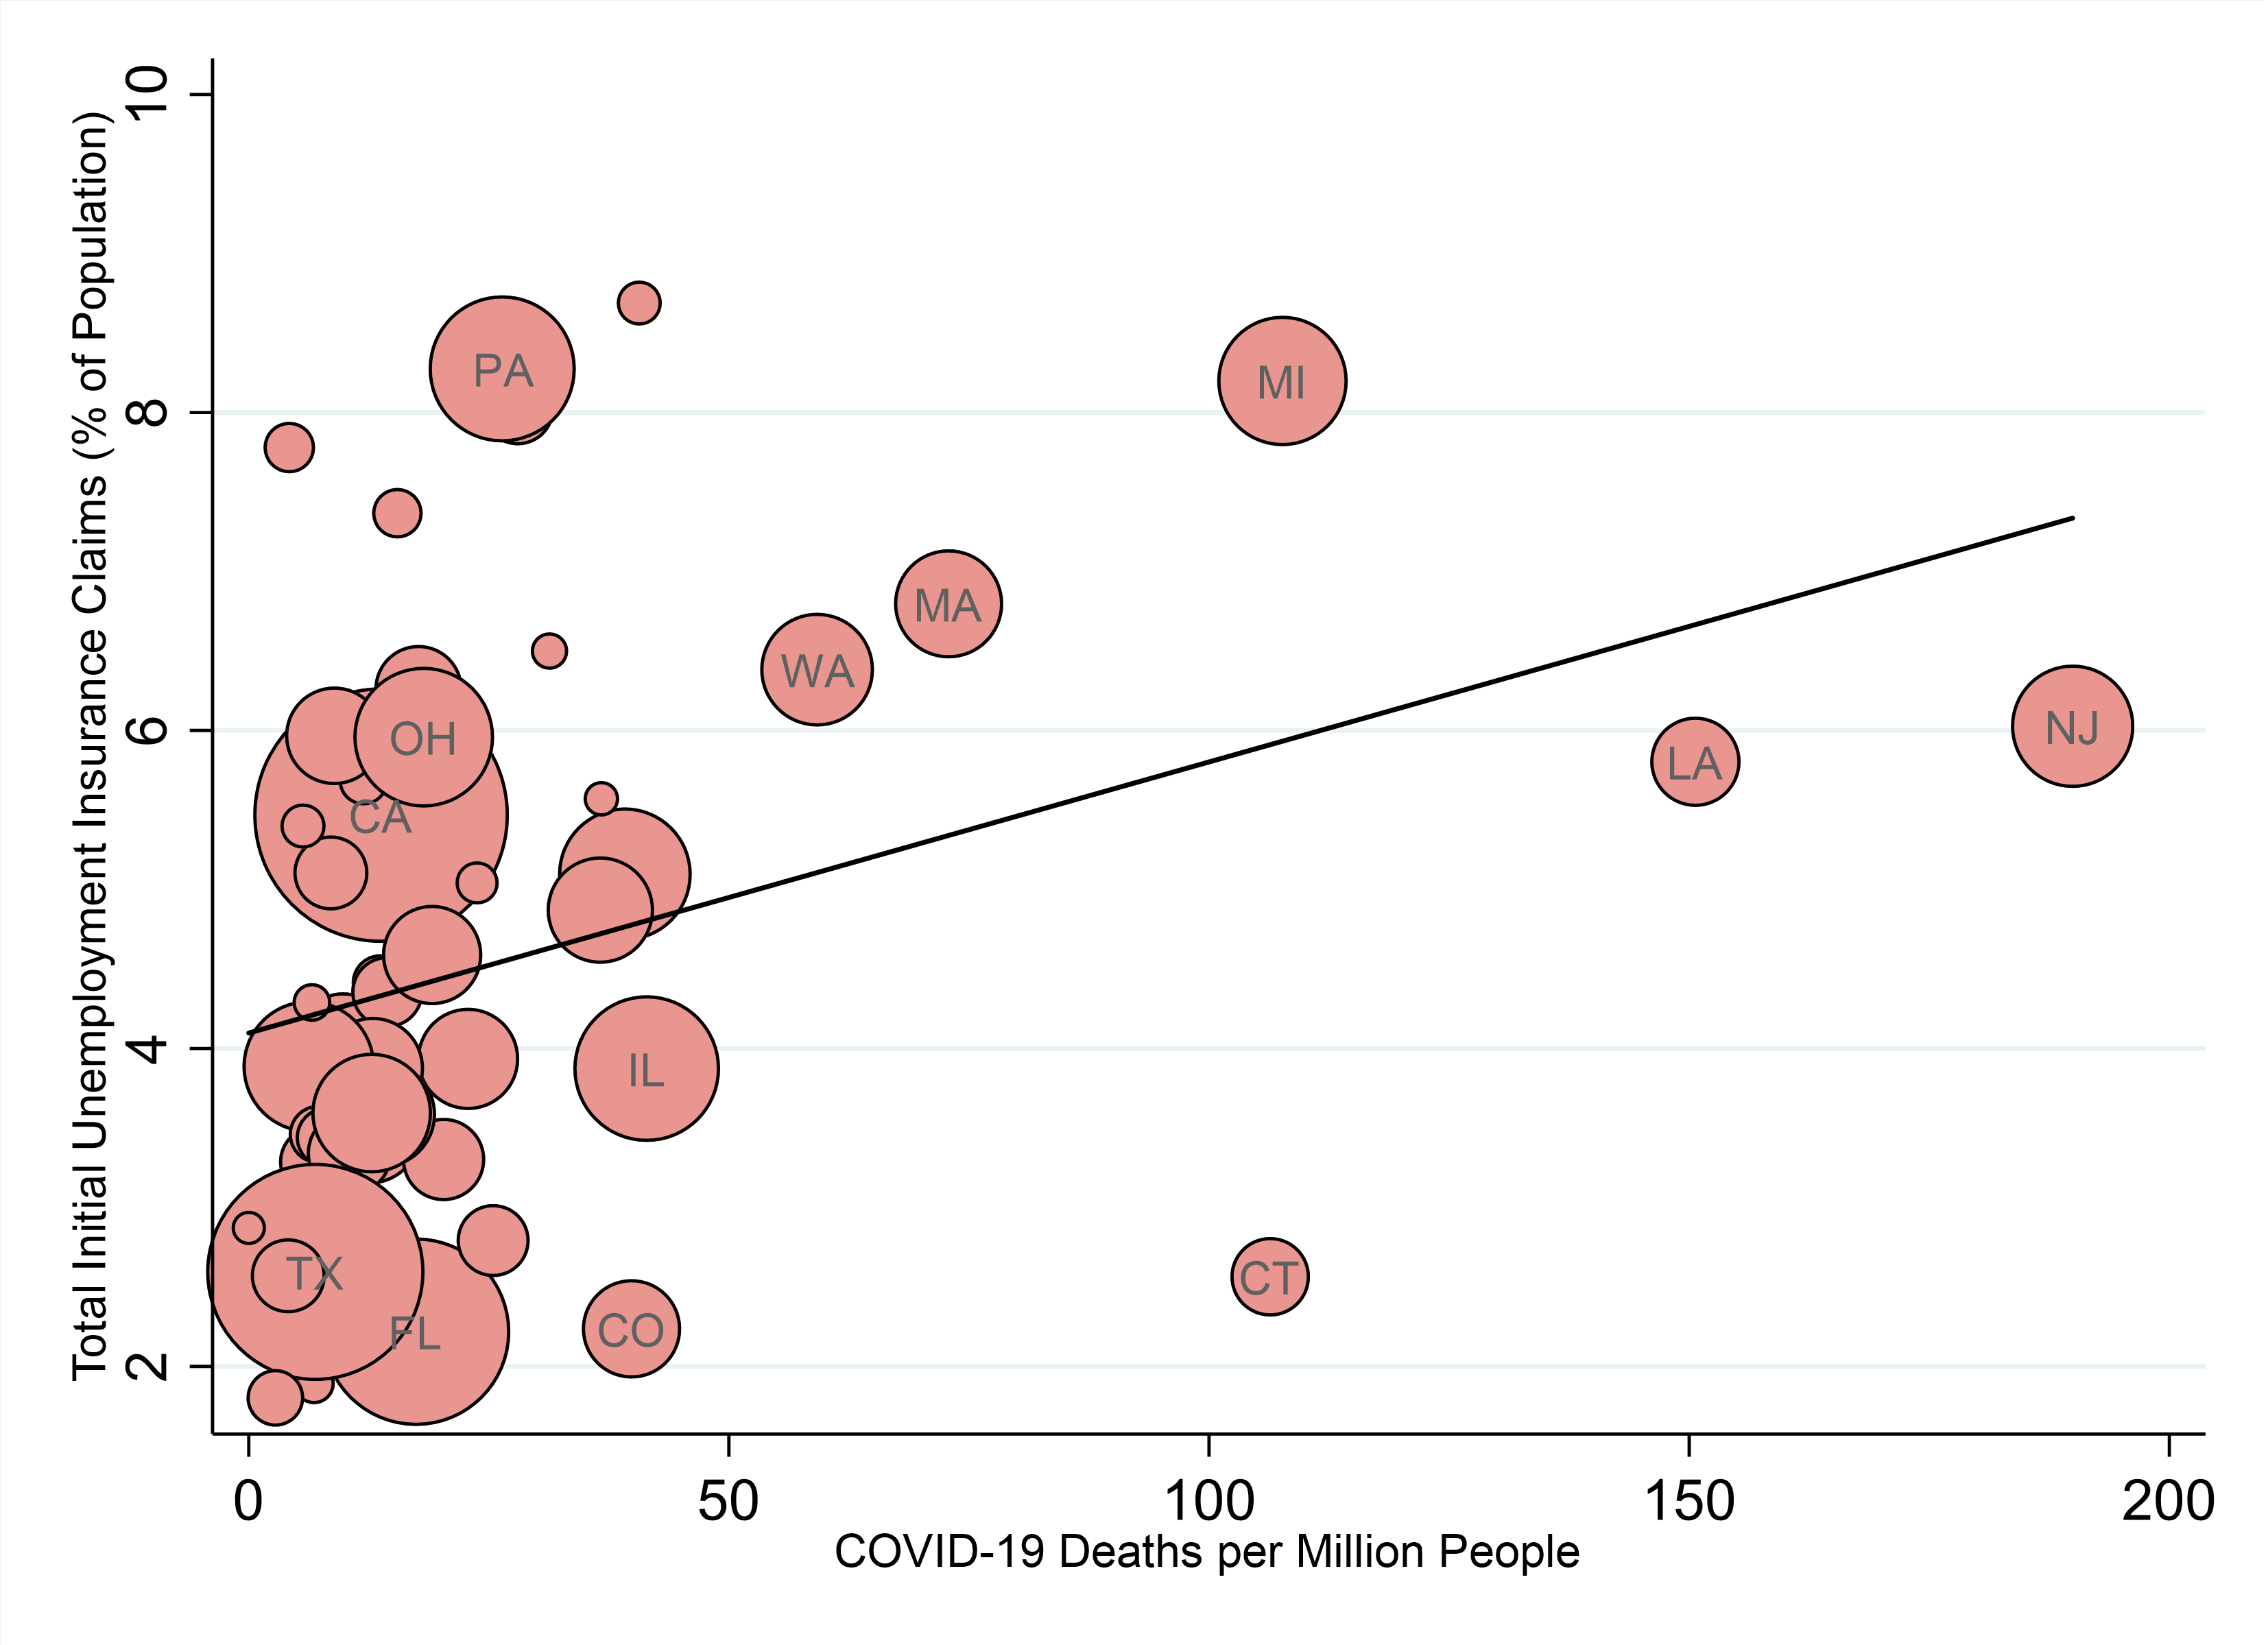
NOTES: New York State was excluded because it has a much larger number of COVID-19 deaths relative to the rest, at 360 deaths per million, making it a potential outlier. This figure was constructed using reported deaths by county through April 9, 2020, and the initial claims to unemployment insurance for the weeks ended March 21, March 28 and April 4, 2020. Size of a circle reflects population size of that state.
SOURCES: USAFacts.org, U.S. Department of Labor and author’s calculations.
The strength of this relationship between deaths and jobless claims may reflect two factors:
- Different timing in the implementation of restrictive measures by state and local governments
- Different timing in the evolution of the disease in different areas, which prompts people to adopt more intense social distancing and thus affects business.
As the health crisis continues to progress and possibly starts to impact areas that have been so far less affected, it is likely that we can expect a further and more widespread deterioration in the labor market as well.
Notes and References
1 I used the most recent state-level data from the U.S. Department of Labor. These data are not seasonally adjusted.
2 I excluded the state of New York, which has a much larger number of COVID-19 deaths relative to the rest, at 360 deaths per million, making it a potential outlier.
Additional Resources

Citation
Maximiliano A. Dvorkin, ldquoThe Impact of COVID-19 on Labor Markets across the U.S. ,rdquo St. Louis Fed On the Economy, April 12, 2020.
This blog offers commentary, analysis and data from our economists and experts. Views expressed are not necessarily those of the St. Louis Fed or Federal Reserve System.
Email Us
All other blog-related questions