


When Quantitative Tightening Is Not Quantitative Tightening
After a lengthy period of operating at the zero lower bound and three rounds of large-scale asset purchases, the Fed began its normalization of monetary policy in recent years. Specifically, the Federal Open Market Committee (FOMC) has raised the policy rate (i.e., the federal funds target rate) by 2.25 percentage points from December 2015 to the present. In addition, since late 2017, the FOMC simultaneously has reduced the size of the Federal Reserve’s balance sheet. This blog post is based on remarks delivered at the 2019 U.S. Monetary Policy Forum, New York, Feb. 22, 2019.
While the liftoff from the zero lower bound has generated the most attention, recently more attention has been focused on the effects of reducing the balance sheet. Many have argued that the balance sheet reduction could operate in the background with relatively small macroeconomic effects. However, others have argued that balance sheet reduction could have equal and opposite effects relative to balance sheet expansion (i.e., quantitative easing, or QE) and, accordingly, that there may be relatively large macroeconomic effects. The latter view has sometimes been called “quantitative tightening,” or QT, in global financial markets.
Which of these two views is more accurate? I will argue the case for relatively small macroeconomic effects of balance sheet reduction. But first, I will provide some background on the Fed’s balance sheet over the past decade.
Evolution of the Fed’s Balance Sheet
After the policy rate was lowered to near zero in December 2008, the FOMC implemented three rounds of large-scale asset purchases—primarily of longer-term Treasuries and mortgage-backed securities—over the next several years. These QE programs caused the size of the Fed’s balance sheet to increase substantially, roughly fivefold. Many have argued that QE had important beneficial effects in aiding the economic recovery following the 2007-09 recession.
The FOMC allowed the balance sheet to begin shrinking in nominal terms in the second half of 2017. The balance sheet was shrinking relative to the size of the economy well before that, but I will focus only on the nominal size.
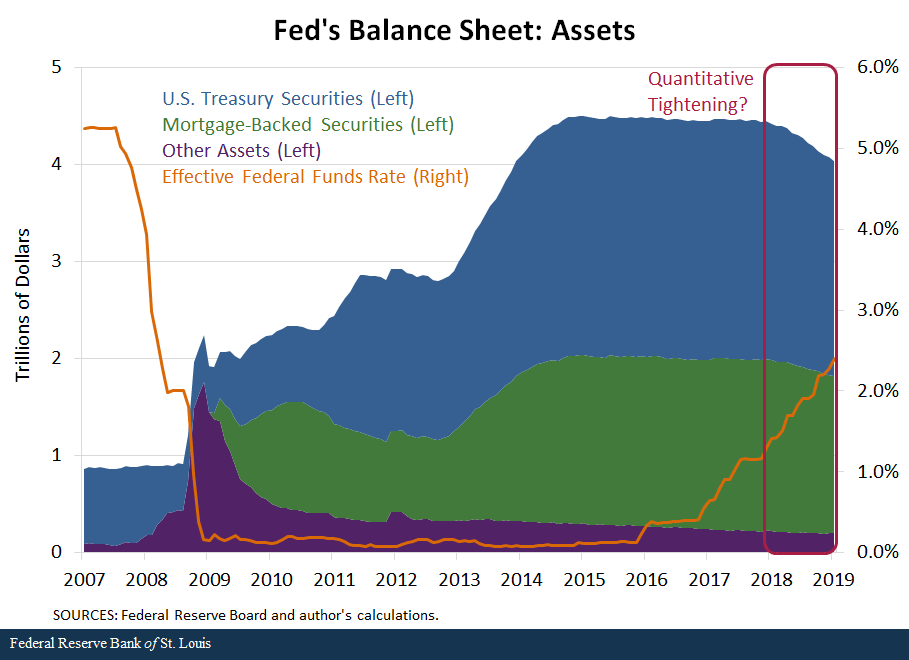
The figure below shows the changes in the asset side of the Fed’s balance sheet since January 2007.
This next figure shows the changes in the liability side of the balance sheet over the same period.
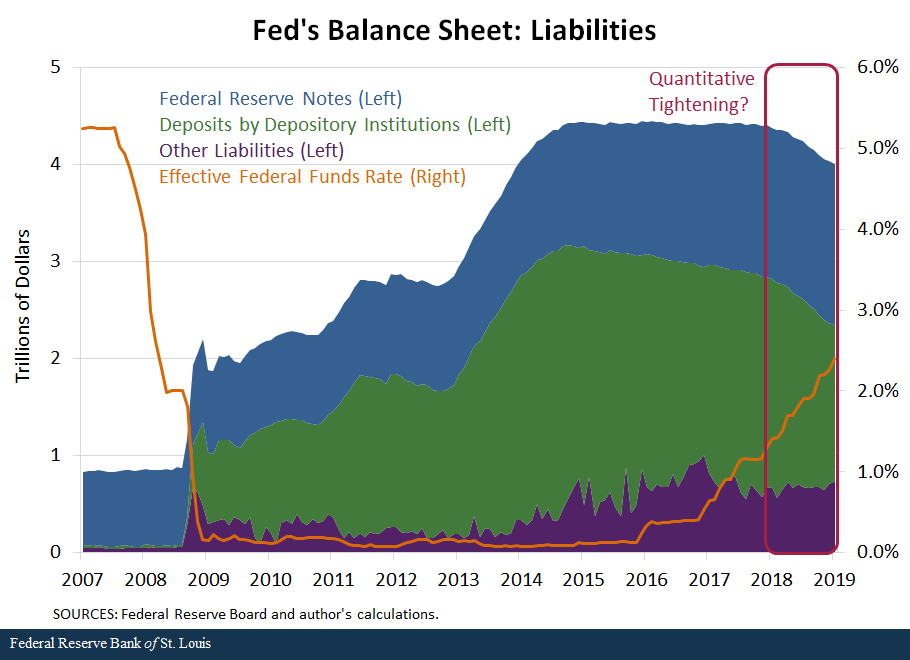
As illustrated in the figures, the size of the balance sheet increased in three main waves, corresponding with the three QE programs. Then, it remained relatively flat in nominal terms for quite a while before it began to decline. The question is whether this reduction is actually quantitative tightening or not.
The Case for Small Effects from QT
I will now turn to the case for relatively small macroeconomic effects of balance sheet reduction. My argument has three parts:
- A baseline neutrality theory suggests that temporarily increasing the Fed’s balance sheet size beyond the minimal level needed to implement monetary policy has no macroeconomic effect at all when the policy rate is well above the zero lower bound.
- When the policy rate was near zero, the Fed’s balance sheet policy nevertheless had an important macroeconomic impact through a signaling channel. In particular, bond purchases signaled “lower for longer” for the policy rate.
- With the policy rate now well above zero, this signaling channel is no longer operative, and the baseline neutrality theory again applies.
What are the policy implications of this theory? My argument suggests that it is indeed possible to view QE as having an important influence on the macroeconomy and simultaneously view the macroeconomic effects of reducing the balance sheet as relatively minor.
This may be one reason why the FOMC’s balance sheet reduction policy that began in the fall of 2017 seemed to have only minor effects in financial markets—even though this balance sheet reduction has arguably been significant. The Fed has been able to reduce reserve balances (deposits by depository institutions) by about 40 percent from the peak of $2.8 trillion, which occurred in July 2014. (The overall size of the balance sheet has declined by a lower percentage from its peak of $4.5 trillion due to currency growth.)
Baseline Neutrality
The neutrality proposition comes from a 2010 paper by Vasco Cúrdia and Michael Woodford. The authors analyzed a standard New Keynesian model that had financial intermediation and bank reserves. See Cúrdia, Vasco; and Woodford, Michael. “Conventional and Unconventional Monetary Policy.” Federal Reserve Bank of St. Louis Review, July/August 2010, Vol. 92, No. 4, pp. 229-64 They argued that in situations where financial markets are functioning properly, temporarily expanding the level of reserves beyond the satiation point for banks (that is, beyond the point at which all the reserve demand has been met) would have no direct effect on the economy.
This is one way to formulate a neutrality theorem for the size of the Fed’s balance sheet in ordinary times when financial markets are working properly. We can take “ordinary times” to mean that the policy rate is not pinned down at very low levels but is well above the zero (or effective) lower bound.
Signaling Effects from QE
However, QE was not implemented in ordinary times, and the actual effects of QE appear to be far from neutral. For example, see Bhattarai, Saroj; and Neely, Christopher J. “An Analysis of the Literature on International Unconventional Monetary Policy.” Federal Reserve Bank of St. Louis Working Paper No. 2016-021C, October 2018. There are many ideas about why this may be so. A leading theory is that QE did not have direct effects on the economy but did send a credible signal about how long the FOMC intended to keep the policy rate near zero.
One set of estimates documenting important signaling effects from QE comes from a 2014 paper by Michael Bauer and Glenn Rudebusch. Bauer, Michael D.; and Rudebusch, Glenn D. “The Signaling Channel for Federal Reserve Bond Purchases.” International Journal of Central Banking, September 2014, Vol. 10, No. 3, pp. 233-89. See Figure 3 on p. 265. They estimated the effect of QE announcements on forward rates and found that a sizable part of the effect was due to expectations for future policy.
The signaling argument seems to work reasonably well if the policy rate is near zero. In that situation, the FOMC may wish to signal convincingly that it will keep the policy rate near zero “for longer”—that is, beyond the time that an ordinary approach to monetary policy would call for rising rates. QE may have been a good approach to accomplish this objective, which is why it had important effects.
Signaling Effects Dissipate
The FOMC normalized the policy rate to a considerable extent during 2017 and 2018—raising it by 1.75 percentage points in total over those two years. (The federal funds rate target range is currently 2.25-2.50 percent.) Once the policy rate rose meaningfully above the zero lower bound, balance sheet movements no longer provided a valuable signal about the future policy rate path.
Given that the signaling effects have dissipated, this means that the neutrality theorem described above would again apply. This also means that the size of the balance sheet could be reduced without important macroeconomic consequences as long as the level of reserves stays above the satiation point needed to implement monetary policy.
Thus, the balance sheet reduction could indeed occur in the background. Furthermore, it could be as boring as “watching paint dry”—a phrase used by my colleague Patrick Harker, who is president and CEO of the Federal Reserve Bank of Philadelphia. For example, see Harker, Patrick T. “Economic Outlook: The Labor Market, Rates, and the Balance Sheet.” Remarks delivered at the Market News International (MNI) Connect Roundtable, New York, May 23, 2017
Asymmetric Effects for QE and QT
To summarize my argument, the financial and macroeconomic impact of the FOMC’s balance sheet policy may well be asymmetric. That is, the size of the balance sheet may have mattered while it was increasing but not while it has been decreasing.
With the policy rate near zero, the effects of QE may have been substantial due to signaling effects. Now, with the policy rate well above zero, any signaling effects from balance sheet changes have dissipated. This means that balance sheet shrinkage, or QT, does not have equal and opposite effects from QE. Indeed, one may view the effects of unwinding the balance sheet as relatively minor.
Caveats
There are many theories of unconventional monetary policy, and I have emphasized just one possible theory that may be important.
Nevertheless, this theory has some empirical support and seems to be consistent with observed large impacts on financial markets from unanticipated announcements of QE policy actions.These impacts are documented in Bhattarai, Saroj; and Neely, Christopher J. “An Analysis of the Literature on International Unconventional Monetary Policy.” Federal Reserve Bank of St. Louis Working Paper No. 2016-021C, October 2018. This theory is also consistent with the seemingly small observed impacts from unanticipated announcements of QT policy actions during 2017.
Conclusion
I have presented an argument for why we might expect asymmetric effects of Fed balance sheet policy. When the policy rate was near zero, the FOMC wished to signal “lower for longer,” and QE provided a way to credibly provide that signal. Once the policy rate moved well above the zero lower bound, the size of the balance sheet no longer provided any signal for the future direction of monetary policy.
This provides one rationale for why balance sheet policy may be less important today than it was during the period when QE was most effective.
Notes and References
1 This blog post is based on remarks delivered at the 2019 U.S. Monetary Policy Forum, New York, Feb. 22, 2019.
2 The authors analyzed a standard New Keynesian model that had financial intermediation and bank reserves. See Cúrdia, Vasco; and Woodford, Michael. “Conventional and Unconventional Monetary Policy.” Federal Reserve Bank of St. Louis Review, July/August 2010, Vol. 92, No. 4, pp. 229-64.
3 For example, see Bhattarai, Saroj; and Neely, Christopher J. “An Analysis of the Literature on International Unconventional Monetary Policy.” Federal Reserve Bank of St. Louis Working Paper No. 2016-021C, October 2018.
4 Bauer, Michael D.; and Rudebusch, Glenn D. “The Signaling Channel for Federal Reserve Bond Purchases.” International Journal of Central Banking, September 2014, Vol. 10, No. 3, pp. 233-89. See Figure 3 on p. 265.
5 For example, see Harker, Patrick T. “Economic Outlook: The Labor Market, Rates, and the Balance Sheet.” Remarks delivered at the Market News International (MNI) Connect Roundtable, New York, May 23, 2017.
6 These impacts are documented in Bhattarai, Saroj; and Neely, Christopher J. “An Analysis of the Literature on International Unconventional Monetary Policy.” Federal Reserve Bank of St. Louis Working Paper No. 2016-021C, October 2018.
Additional Resources
- President Bullard’s website
- Presentation: When Quantitative Tightening Is Not Quantitative Tightening
- On the Economy: Reflections on Crisis to Recovery

Citation
James Bullard, ldquoWhen Quantitative Tightening Is Not Quantitative Tightening,rdquo St. Louis Fed On the Economy, March 7, 2019.
This blog offers commentary, analysis and data from our economists and experts. Views expressed are not necessarily those of the St. Louis Fed or Federal Reserve System.
Email Us
All other blog-related questions