


How Recent Fiscal Interventions Compare with the New Deal
KEY TAKEAWAYS
- Although pandemic-related spending has been steep, this isn’t the first time the federal government has used spending to revive the economy.
- President Franklin D. Roosevelt’s New Deal is a prime example of using extensive fiscal support to stimulate economic growth.
- As a share of annual GDP, pandemic-related spending has been smaller than the amount spent on the New Deal. But it could rival the New Deal in relative size if recent proposals come to pass.

Although pandemic-related fiscal policies have generated much attention in the past several months, the federal government has spent large sums before in an effort to help boost the U.S. economy and reinforce the nation’s public infrastructure.
Notable examples include the American Recovery and Reinvestment Act of 2009, passed in response to the Great Recession, and the Federal-Aid Highway Act of 1956. But, accounting for changes in the U.S. economy over time, at least until recently the largest federal spending program was the New Deal—President Franklin D. Roosevelt’s response to the Great Depression. It consisted mainly of a series of public works programs that began in 1933.
This article compares the size of the New Deal to recently enacted and proposed fiscal actions in the U.S.
Actions by the Biden Administration
President Joe Biden signed the American Rescue Plan into law on March 11, 2021, at a total budget cost of $1.9 trillion. It continued a number of programs introduced by the 2020 Coronavirus Aid, Relief, and Economic Security (CARES) Act of 2020, such as extended and expanded unemployment insurance benefits and means-tested direct payments to individuals. It also established a fund to help state, local and tribal governments address revenue losses caused by the pandemic.
On March 31, Biden proposed the American Jobs Plan, initially set to cost $2.3 trillion. At the time of this writing, negotiations between political parties were whittling this amount. Major components that remained included funding for electrical power, water and broadband infrastructure and highway and public transit improvements. Other components originally proposed—including money to improve U.S. supply chains and to support older adults and people with disabilities—were likely to fall away by the time this article publishes.
Finally, on April 28, Biden proposed the $1.8 trillion American Families Plan. It would include funding for pre-K and community college; government subsidized, paid family and medical leave; and expanded health insurance coverage through the Affordable Care Act. At the time of this writing, negotiations on the American Families Plan had not yet begun.
To be as concrete as possible in my calculations, I included the initially proposed price tags of the last two plans, recognizing that the Jobs Plan and the Families Plan might end up having very different dollar figures or potentially not become law. That said, the sum cost of all three plans is $6 trillion.
Fiscal Relief Actions under the Trump Administration
In March and April 2020, at the beginning of the COVID-19 pandemic in the U.S., then-President Donald Trump signed into law four fiscal relief packages totaling $2.4 trillion. The largest of these was the CARES Act.
Several major components of the CARES Act included direct federal stimulus payments to households, the Paycheck Protection Program for small businesses, larger unemployment payments for individuals, funding to state and local governments to cover COVID-19-related expenses and financial assistance to states for Medicaid. An additional $900 billion was authorized by a December 2020 appropriation. Thus, COVID-19 relief authorized during 2020 totaled $3.3 trillion.
To limit the number of calculations below, I combined the Biden and Trump totals to get a grand sum of $9.3 trillion.
Cost Comparison to the New Deal
In 1933, FDR began providing economic relief through an “alphabet soup” of New Deal programs to combat the Great Depression.See Robert McElvaine’s 1993 book, The Great Depression: America 1929-1941, for a history of the Depression and New Deal. These included the Agricultural Adjustment Administration (AAA), which paid farmers to kill off some of their livestock and reduce farm production to help raise commodities prices, and the Works Progress Administration (WPA), which hired millions of unemployed workers to build infrastructure, including public buildings and roads.
Total New Deal federal spending was $41.7 billion in then-current dollars, according to a 2015 study by Price Fishback and Valentina Kachanovskaya. That translates to $793 billion today.
At first glance, the New Deal seems much smaller than more recent fiscal interventions; however, over the past 90 years, prices and the U.S. population have risen substantially. Because of that, I adjusted the raw dollar totals for these two changes. On a per capita basis, the combined cost of the Biden and Trump interventions would equal $28,184—much larger than the $6,280 per capita cost of the New Deal in today’s dollars.
Another way the U.S. has changed is that the economy has gotten much larger through advances in productivity and the accumulation of capital. This has driven up the output of the U.S. economy and households’ standard of living. We can account for this change by comparing the fiscal programs to the economy’s gross domestic product (GDP) during the relevant period.
Cost as a Share of National Output
GDP measures the total monetary value of finished goods and services made within a nation during a certain period. The cost of the New Deal was 40.1% of GDP in 1929. By comparison, the existing and proposed fiscal actions by both administrations are 43.2% of 2019 GDP.
The figure below depicts these two percentages as well as a few others:
- The 2009 Recovery and Reinvestment Act as a share of 2006 GDPI chose 2006 as the GDP comparison year because it precedes the 2007-09 recession, the impetus for the corresponding stimulus.
- Existing fiscal actions by both administrations as a share of 2019 GDP
- All three Biden plans as a share of 2021 GDP
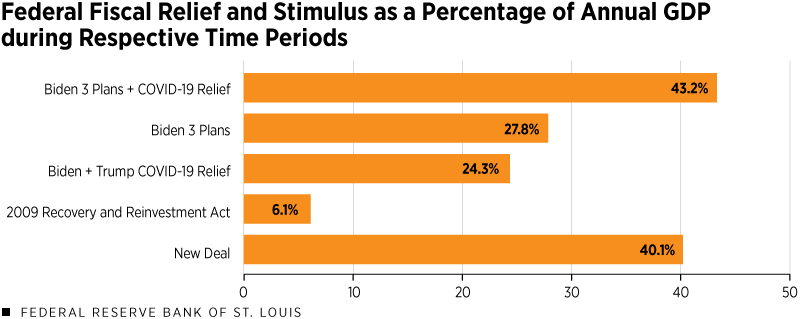
SOURCES: Bureau of Economic Analysis, Congressional Budget Office, "The Multiplier for Federal Spending in the States During the Great Depression" by Fishback and Kachanovskaya, the White House and author’s calculations.
NOTES: The respective periods used in these calculations are 1929 for the New Deal, 2006 for the Recovery and Reinvestment Act and 2019 for the remaining calculations. Fiscal costs for proposals not yet passed (i.e., the American Jobs Plan and the American Families Plan), are as initially proposed by the Biden administration.
Note that while total fiscal spending in both cases is spent over a number of years (i.e., the numerator), we use one year’s GDP in the denominator. For instance, the New Deal lasted roughly six years. While much of the recent federal spending will have taken place in 2020 and 2021, the latter two Biden plans (if passed) are likely to be spread out over about 10 years. It’s worth keeping that in mind when examining these numbers.
Although the New Deal and the existing and proposed fiscal actions are alike when measured as a fraction of output, the U.S. economy in the respective business cycles of the two periods was at very different points.
During the early 1930s, the general price level fell by 30% and the unemployment rate reached 25%. The COVID-19-induced recession, thus far, has seen relatively stable prices and—after a temporary unemployment spike of 14.8% by April 2020—a relatively fast labor market recovery. Time will tell how these differences in initial conditions impact the economy’s response to fiscal actions.
Iris Arbogast, a research associate at the Bank, provided research assistance.

Views expressed in Regional Economist are not necessarily those of the St. Louis Fed or Federal Reserve System.
For the latest insights from our economists and other St. Louis Fed experts, visit On the Economy and subscribe.
Email Us