


Electricity: The Next Energy Jolt?
Nowadays, it’s commonplace to associate the phrase “energy crisis” with sky-high petroleum and natural gas prices. But the electricity sector is not immune from crisis, as evidenced by the rolling blackouts in Texas in 2005 and the blackout that hit the upper Midwest, Northeast and part of Canada in 2003. Widespread electricity outages usually are short and stem from either a weather-related cut in service or from demand beyond the capacity of utilities to produce.
This article will focus mostly on factors that have affected changes in the demand for and supply of electricity over time, rather than changes in quantity demanded. The distinction, while perhaps subtle to the noneconomist, is important. In addition, issues related to the transmission of electricity over the nation’s electricity grid will be briefly discussed. Because imports of electricity are negligible and because electricity cannot be feasibly stored in mass quantities like petroleum products or other commodities, effective transmission from the producer to the consumer is a necessity if supplies are to be uninterrupted.
Although the United States has become much more energy-efficient over time, growth in electricity capacity has generally lagged well behind the growth of electricity demand over the past 25 years.1 As a result, the gap—or margin—between production capacity and consumption during peak load periods has narrowed significantly. With some energy economists expecting the summertime safety margin to narrow even further in the coming decade, what are the prospects for electricity demand and supply over the next several years?
Factors Affecting Demand and Supply
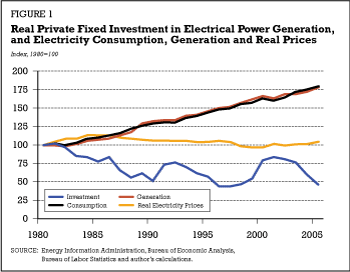
As seen in Figure 1, U.S. electricity consumption and generation have grown at essentially the same rate over time because it is costly to store electricity and imports are negligible. Between 1980 and 2005, electricity generation has increased at an average annual rate of 2.3 percent, while electricity sales (consumption) have increased at a 2.4 percent annual rate.2 Figure 1 also reveals that real electricity prices paid by consumers have remained roughly constant over time. After falling at a 1 percent annual rate from 1985 to 2000, real electricity prices have increased at about a 1.25 percent annual rate since 2000.
Over time, electricity consumption is influenced by several factors other than growth of the population. Technological change is among the most important. In 1900, electricity provided less than 10 percent of the mechanical power in American industry. By 1930, with the widespread use of the dynamo (electric generator), electricity provided more than 75 percent of the industry’s mechanical power.3
Since the dynamo, other general purpose technologies have had far-reaching effects on the economy. The widespread adoption of central air conditioning after World War II is one example. More recently, there’s been the semiconductor. Used in a myriad of computer, information and communications devices, the semiconductor seems to have spurred an increase in the demand for electricity by households and firms, thereby contributing to the growing gap between electricity generating capacity and consumption.4
One of the most important uses of the computer is to access the Internet—both as an information source and as a conduit of transactions between individuals and firms and between businesses. To many firms, a vital part of their business model is the call center. Reportedly, one large call center uses enough electricity to power a city of 30,000 to 40,000 residents. With such facilities being a key asset of firms like Microsoft, Dell, Hewlett-Packard and Yahoo, several high-tech firms have been attempting to secure lower-cost sources of electricity. These strategies include constructing their own power supplies or locating facilities near existing power plants to secure favorable pricing from the utility.5
Another factor that has probably increased the demand for electricity over the past decade or so is the housing boom, and in particular, the increasing size of new homes. From 1970 to 1990, the average new home increased in size by nearly 39 percent, to 2,080 square feet from 1,500 square feet.6 By 2004, the size of the average new home had increased by an additional 13 percent to about 2,350 square feet. With the housing boom continuing into 2005, it is conceivable that the average has increased even further. Moreover, 90 percent of all new homes in 2004 had central air conditioning vs. only 34 percent in 1970. Although today’s homes and appliances are more energy-efficient, larger houses generally require more energy to cool and heat than do smaller houses.
The nation’s supply of electricity depends not only on the raw materials used to produce electricity, but the number of power plants and their capacity. For an electricity-generating facility, several years can elapse between the planning and design stage to the operational stage. This is true for coal and, especially, nuclear power plants. Moreover, since electrical generation facilities have a fixed service life—that is, they wear out or become obsolete because of new technologies—net fixed investment rates have to be positive over time to meet the needs of a growing economy and populace. The short-run dynamics are different. During periods when the demand for electricity increases sharply, utilities employ unused capacity to meet increased demand. They must do this because it is economically unfeasible to store large amounts of electricity.7
Figure 1 also indicates that real, private, fixed investment in electricity generation remains below the level seen in 1980.8 In fact, fixed investment in new electricity generation structures has declined at a 2.9 percent annual rate since 1980. Going forward, new investment will be necessary to offset retirement of existing facilities and to meet the increased demand associated with new technologies and increasing population. But by how much? The 2006 Annual Energy Outlook (AEO), published by the U.S. Energy Information Administration (EIA), projects that electricity consumption will increase by 1.5 percent per year from 2005 to 2030, which is about three-quarters of a percentage point slower than the growth rate experienced from 1980 to 2005. According to the EIA, this slowing stems from increased energy efficiency and a slower rate of population growth.
Over the past 25 years, the combination of structural changes in the economy and negative real investment rates in electricity-producing structures have had consequences. One consequence was a narrowing margin between production capability (capacity) and summertime demand (peak load). Typically, the difference between peak-load capacity and demand is the smallest during the summer months, when homes and businesses use their air conditioners.9 In fact, of the eight major North American power outages (blackouts) since 1984, six occurred during the summer months. Included in this list was the August 2003 blackout, which affected an estimated 50 million people in eight U.S. states and one Canadian province.10
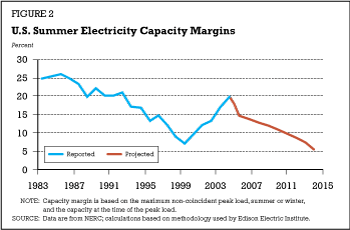
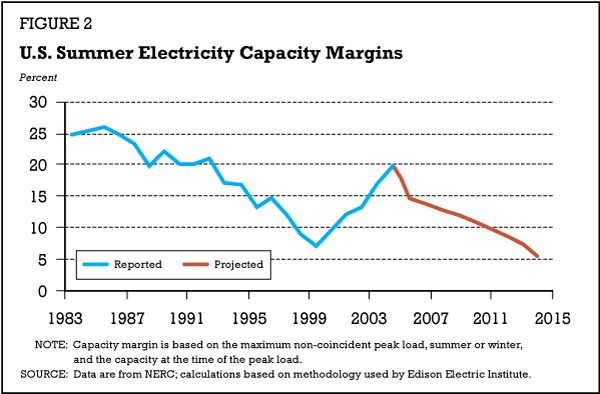
Each year, the North American Electric Reliability Council (NERC) publishes its Long-Term Reliability Assessment (LTRA). This report discusses the reliability of the bulk electric systems (major electricity grids) in North America. The industry’s summertime capacity margin is one of the indicators that the council monitors closely.
As seen in Figure 2, summer electricity capacity margins declined significantly from the early 1980s to the late 1990s. From 1985 to 1999, capacity margins fell from nearly 26 percent to 7 percent, a development that appears consistent with the investment trends seen in Figure 1. Although an upswing in fixed investment over the latter half of the 1990s boosted capacity margins to an estimated 19.8 percent in 2004, long-term projections of U.S. summer capacity margins have been steadily marked down since 2002. Currently, as seen in Figure 2, margins by 2014 are expected to be down to about 5 percent, which would be below the record-low levels seen in 1999.
Is Enough Capacity Being Built?
The Annual Energy Outlook is a comprehensive overview of current trends in the supply of and demand for all types of energy consumed and produced by U.S. firms and households. A key aspect of each of the annual outlooks is the EIA’s long-run projections (typically 20 years ahead) of U.S. domestic energy consumption and generation. To see how the industry’s energy outlook can change over time in response to unforeseen developments, look at how the EIA’s long-run electricity projections have changed over time using three AEO vintages—those from 1996, 2001 and 2006.
1996
The EIA projected that to meet growing demand and offset the retirement of obsolete plants, capacity additions totaling about 252 gigawatts (excluding cogeneration) would be needed by 2015. The agency assumes that an average new plant has a capacity of 300 mega-watts; so, this amounts to 840 new plants. The EIA expected that about 75 percent of the new capacity would be natural gas-fired plants; coal-fired plants would make up an additional 20 percent. Coal-fired plants are usually more economical because the price of coal on an energy-equivalent basis is generally less than the price of natural gas. In 1999, according to the EIA, fuel costs represented nearly 80 percent of the total operating costs for a 300 megawatt coal-fired plant, but 98 percent for a comparable-sized natural-gas-fired generation plant.11 Thus, the industry generally builds natural gas plants to ensure a reliable source of energy for the relatively few hours each day when electricity demand is high.12
2001
With capacity margins having dwindled to extremely low levels in recent years, the EIA was warning that the country would need to build a substantial number of new power plants over the next two decades to prevent widespread outages during peak usage. The EIA projected that 393 gigawatts of new capacity would be needed over the next 20 years, which was a 56 percent increase from the long-term projections published five years earlier. This total represented an increase of a little more than 1,300 new plants. Nearly all (approximately 92 percent) of the additional generating capacity that was projected to come on line by 2020 were natural gas-fired plants. Coal-fired generating capacity comprised most of the remaining 8 percent of the projected new generating capacity.
2006
Given the magnitude of the new generating capacity projected in the 2001 Annual Energy Outlook, it appears that the Energy Information Administration was surprised by the steep decline in capacity margins in the latter part of the 1990s. However, this projection error seems understandable given the technological innovations that occurred in the 1990s that appear to have increased the demand for electricity relative to the available supply.
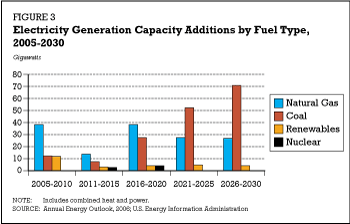
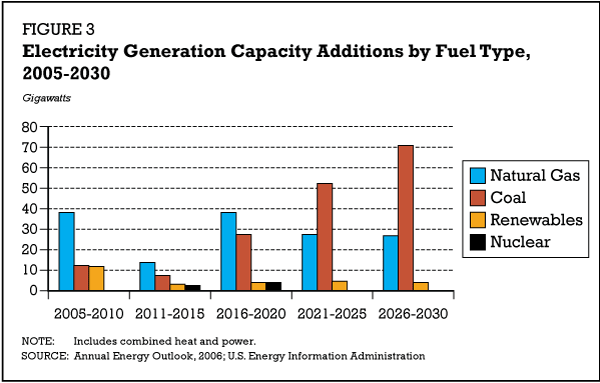
According to the 2006 report, the EIA projects that U.S. electricity generating capacity will need to increase by about 347 gigawatts between 2005 and 2030, which is 12 percent less than its 2001 long-term projection. A little more than half of the total capacity (54 percent) is projected to come on line between 2021 and 2030. As seen in Figure 3, which details the current long-run projections in electricity generation capacity by fuel type, there has been a sharp departure in the fuel mix that was projected in 2001. Recall that in 1996 and 2001, the bulk of the new power plants to be built were expected to be natural gas-fired. Now, the EIA foresees that the majority of the new power plants in the latter part of the projection period are expected to be coal-fired. This could reflect two developments. First, utilities might be building relatively more capacity for the longer run rather than to meet peak load demand. Second, utilities could be expecting natural gas prices to remain permanently higher compared with the utilities’ previous assumption.
However, coal prices have also risen sharply in recent years. From 1980 to 2000, the price of coal was essentially flat in nominal terms. From 2001 to 2005, coal prices rose by about 33 percent. The expected switch to coal-fired capacity over the longer run occurs even though the EIA has significantly raised its estimate of the real price of coal. In 1996, the EIA projected that real coal prices were expected to fall by 0.5 percent per year over the next 20 years. Currently, EIA projects that the real price of coal will increase by 0.3 percent per year over the next 20 years.
Changes in public policy also can affect generating capacity in the long run. For example, in response to the tax incentives that were incorporated into the Energy Policy Act of 2005 (EPACT), additional generating capacity from nuclear and renewable energy sources is expected to be built. By 2030, as shown in Figure 3, six gigawatts of nuclear and about 27 gigawatts of renewable energy facilities are expected to be operating.
Other Concerns
In its 2006 Summer Assessment issued in May, NERC had warned that the gap between expected demand and available supply was going to be “tighter than last summer across much of North America.” But in a subsequent report issued in August, the agency noted that the power system performed “quite well” during the July heat waves in the United States. NERC also said in its May assessment that reduced coal deliveries to electric power generators from the Powder River Basin in Wyoming and southeastern Montana were a concern. This development, which is more of a short-run disturbance, stemmed from damage to rail lines in 2005 that arose from flooding and a train derailment. Although some utilities in the Midwest and Southwest have warned of the possibility of rolling blackouts due to short coal supplies, through May 2006 the EIA reported that total U.S. coal stocks held at electric utilities were up by 11 percent from a year earlier.13
In addition to longer-run concerns about capacity margins, NERC has warned that transmission capacity will begin to be a pressing issue going forward. The agency noted as much in its 2005 Long-Term Reliability Assessment:
North American transmission systems are expected to meet reliability requirements in the near term. However, as customer demand increases and transmission systems experience increased power transfers, portions of these systems will be operated at or near their reliability limits more of the time (Page 5).
From 1989 to 2004, a little more than 14,000 high-voltage transmission circuit miles were added in the United States, which amounted to an increase of 0.6 percent per year. This increase was about one quarter of the roughly 2.25 percent annualized growth in electricity consumption over this period. Although the August 2003 blackout task force noted that no major electricity transmission circuit projects have occurred over the past 10 to 15 years, eroding the system’s reliability, NERC nonetheless reports that actual circuit miles have exceeded projections for each year from 2000 to 2005. NERC projects that about 10,000 miles of high-voltage transmission lines will be added between 2005 and 2014. While significant, this is still a growth rate of only 0.6 percent per year. Moreover, this growth still lags the projected 1.75 percent annual growth of electricity sales over this period, according to the EIA.
Summary
Since 1980, growth in the consumption of electricity has outpaced the growth in investment in new generating facilities. As a result, peak-capacity margins dwindled to extremely low levels in the latter part of the 1990s, and, while they have recently rebounded, some energy economists expect even smaller margins by 2014. Still, the industry is expected to add a considerable amount of coal-fired generation capacity over the next 20 years and, partly in response to the Energy Policy Act of 2005, a significant amount of new capacity from nuclear and renewable energy sources. These projections, though, are based on a sizable slowing in the growth of electricity consumption that was seen from 1980 to 2005. Finally, some economists are concerned that industry is not adding enough to its capacity to deliver electricity over bulk transmission lines, potentially increasing the risk of supply disruptions.
Figure 1
Real Private Fixed Investment in Electrical Power Generation, and Electricity Consumption, Generation and Real Prices
Endnotes
- The total amount of energy used to produce $1 of real final goods and services (GDP) has declined from a little more than 19,500 Btu in 1949 to about 9,000 Btu in 2005. [back to text]
- Since 1980, real GDP has increased at an average annual rate of 3.1 percent. [back to text]
- See Kliesen and Wheelock (2001). [back to text]
- See Anderson (2001). [back to text]
- See Delaney and Smith (2006). [back to text]
- See National Association of Homebuilders (2006). [back to text]
- Imports of electricity, mostly from Canada, are another potential source. However, the total amount imported in 2004 was only 0.8 percent of total net generation. [back to text]
- The dollar value of new construction of electrical generating facilities. [back to text]
- Capacity margin is measured as the difference between capacity at summer peak load and the summer non-coincident peak load, divided by the former and multiplied by 100. [back to text]
- See U.S.-Canada Power System Outage Task Force (2004). [back to text]
- See 2001 Annual Energy Outlook, p. 74. [back to text]
- See 2006 Annual Energy Outlook, p. 77. [back to text]
- See Hornaday (2006). [back to text]
- British Thermal Units is the U.S. measure of product’s energy content. According to an online encyclopedia, “a pound (0.454 kilogram) of good coal when burned should yield 14,000 to 15,000 Btu; a pound of gasoline or other fuel oil, approximately 19,000 Btu.” See www.answers.com/topic/british-thermal-unit. [back to text]
References
Anderson, Roger. “Wattage Where It’s Needed.” New York Times, June 6, 2001, p. 31, accessed at The Earth Institute at Columbia University. See www.earthinstitute.columbia.edu/news/aboutStory/about6_1_01.html.
Delaney, Kevin J.; and Smith, Rebecca. “Surge in Internet Use, Energy Costs Has Big Tech Firms Seeking Power.” The Wall Street Journal, June 13, 2006; p. A1.
Hornaday, Bill W. “Not Enough Coal on Hand, Utilities Warn: Threat of Rolling Blackouts Highlighted in Industry Letter.” Arkansas Democrat-Gazette, May 6, 2006, p. 1.
Kliesen, Kevin L.; and Wheelock, David C. “The Microchip Flexes Its Muscle: Can It Compete With History’s Best?” Federal Reserve Bank of St. Louis The Regional Economist, July 2001, pp. 5-9.
National Association of Homebuilders. “Housing Facts, Figures and Trends.” March 2006. See http://www.nahb.org/ fileUpload_details.aspx?contentTypeID =7&contentID=2028.
North American Electric Reliability Council. 2006 Summer Assessment: Reliability of Bulk Power System in North America. May 2006.
2005 Long-Term Reliability Assessment: The Reliability of Bulk Electric Systems in North America. September 2005.
U.S.-Canada Power System Outage Task Force. “Final Report on the August 14, 2003, Blackout in the United States and Canada: Causes and Recommendations.” April 2004. See ftp://www.nerc.com/pub/sys/all_updl/docs/blackout/ch1-3.pdf.
U.S. Department of Energy. Energy Information Administration. Annual Energy Outlook. Various issues, Washington.

Views expressed in Regional Economist are not necessarily those of the St. Louis Fed or Federal Reserve System.
For the latest insights from our economists and other St. Louis Fed experts, visit On the Economy and subscribe.
Email Us