


Metro Profile: Bowling Green, Ky.: Cars, College and Caves
Located in western Kentucky between the rapidly growing areas of Nashville, Tenn., to the south and Louisville, Ky., to the north, the Bowling Green metropolitan statistical area (MSA) shares in this region’s relative prosperity. Since 1970, population growth in Bowling Green has outpaced that of the nation and that of the state. In the past decade alone, the metro area’s population has increased 18 percent, double the national rate of 9 percent and triple Kentucky’s rate of 6 percent.
The four-county region that comprises the metro area is centered on the city of Bowling Green, in Warren County.1 The population of the metro area stands at just over 165,000. Three-quarters of the people live in Warren County, and half of those reside in the city of Bowling Green.
Annual output for the region was just under $6 billion in 2013, which is about 3 percent of the state’s total output and about 9 percent of the Louisville MSA’s.
This population and output place Bowling Green among the nation’s smaller metro areas, very close in size to nearby Elizabethtown, Ky., and Bloomington, Ind.2
Being a smaller metropolitan area generally brings with it a lower cost of living, and this is true for the Bowling Green MSA. The cost of living is about 15 percent below the nation’s average, 10 percent below Nashville’s and about 6 percent below Louisville’s. The low cost of living in Bowling Green can be mostly attributed to the low cost of rent/housing: At about $127,000, the median house price is roughly 30 percent below the nation’s average, 25 percent below Nashville’s and 13 percent below Louisville’s. The cost of goods and the cost of services other than rents are 7 and 10 percent below the national average, respectively.
The median household income in Bowling Green is $42,000, roughly 21 percent lower than the national average of $53,000. However, when factoring in the lower cost of living in the region, the “real” median household income in the MSA is about $49,000.4
Cars in a Cave
In February 2014, a sinkhole collapsed under the National Corvette Museum in Bowling Green, claiming eight cars. (No one was harmed.) This event brought together two things that draw national attention to the region: cars and caves.
As in much of Kentucky and Tennessee, the auto industry is a key sector. Bowling Green is home to numerous auto-parts suppliers, as well as to General Motors’ only Corvette manufacturing facility. GM has already invested close to $135 million in refurbishing its Bowling Green plant and recently announced plans to invest an additional $500 million for a new paint shop.
Including the 900 workers at the plant, about 4.3 percent (roughly 3,100 jobs) of the region’s workforce is employed in the transportation equipment manufacturing sector. In comparison, 1.1 percent of the nation’s workforce and 2.9 percent of the state’s are employed in this sector. In addition to auto manufacturing, cars serve as a tourism anchor: The Corvette museum drew more than 250,000 visitors last year.5
Bowling Green is one of only a handful of MSAs that are home to a national park. Mammoth Cave National Park preserves the world’s longest known cave system. More than 400 miles of the cave have been explored in the park, according to the National Park Service. The majority of the park, including its visitor center, is located in Edmonson County, roughly a half-hour drive from downtown Bowling Green. The park attracts about 500,000 visitors annually.
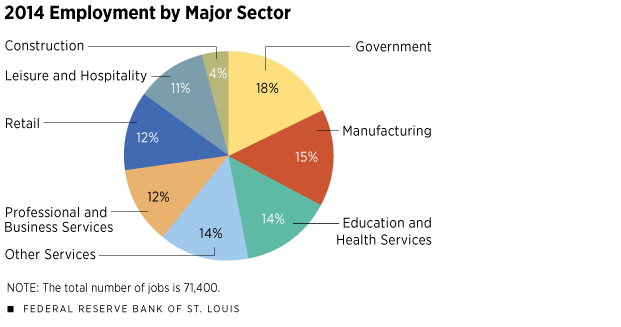
Because of these and other tourist attractions and related businesses, about 11 percent of the workforce in the MSA is employed in the leisure and hospitality sector. The national average is 9.6 percent.
Beyond cars and caves, Western Kentucky University (WKU) plays a significant role in shaping the region’s economy. With an enrollment over 20,000 students, WKU is one of the region’s largest employers. (As a public university, its workers show up on government payrolls.) The university works closely with other local businesses to train the local workforce.
WKU is partly responsible for the high educational attainment in Warren County, relative to the surrounding area. More than a quarter of the population 25 and older in Warren County has a bachelor’s degree or higher, which is roughly three times the rate of the other counties comprising the MSA.6 Thus, Warren County’s educational attainment helps to positively push the broader metro area average. Still, the MSA’s average is below that of the nation: 22.3 percent compared with 28.3 percent.
Businesses contacted for this article expressed concern about the lack of skilled workers despite the positive impact of the university. This isn’t necessarily specific to Bowling Green, as Kentucky has the fourth-lowest college attainment rate in the nation. One contact noted that, outside of the university-driven research and development, there is not a strong environment of innovation. Another contact noted a lack of technology-trained workers available to fill current needs.
No Boom and Bust in Housing
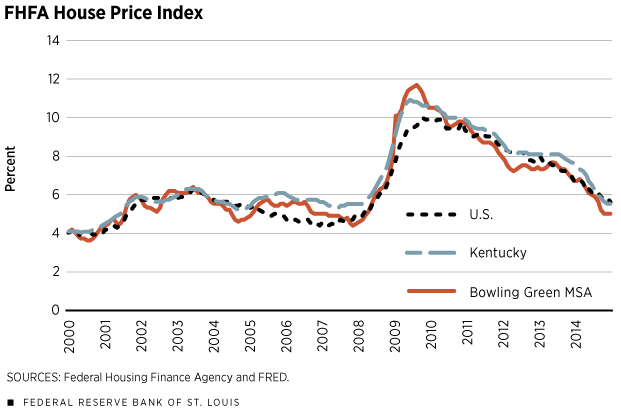
Many business contacts noted that Bowling Green seemed relatively insulated from the drastic housing price changes observed during the bursting of the housing market bubble in 2007. During the housing boom from 1999 to 2006, national home prices increased by about 7 percent per year. In Bowling Green, as in the rest of Kentucky, home prices appreciated by a modest 3.5 percent per year. During the housing bust, national prices fell by 4.4 percent per year, while regional prices fell by only 0.4 percent per year—and then quickly rebounded. Bowling Green’s price decline was also closely aligned to Kentucky’s average price drop. Stable household finances probably helped the local market: The percentage of borrowers who were 90-plus days delinquent on their mortgages rose from 1 percent to only about 4 percent, compared with the increase to 8 percent observed nationally.
Although prices were stable, the local construction industry did take a hit. As the inventory of homes for sale escalated, construction of single-family houses plummeted. Both nationally and locally, the number of permits for single-family homes dropped more than 50 percent between 2007 and 2009, resulting in job losses in the construction sector.
Manufacturing’s Impact
Despite the stability in the housing market, the national collapse in auto sales (and production) during the recession ultimately hurt Bowling Green’s economy. Between 2007 and 2009, the U.S. economy contracted by about 3 percent, while Bowling Green’s economy contracted by 7.5 percent. Given Bowling Green’s large share of workers in the auto industry, job losses in the sector impacted the MSA more than the nation: About 5.6 percent of Bowling Green’s workers lost their jobs over the two-year period, compared with a 4.9 percent loss nationally. The metro area’s unemployment rate reached a high of 11.7 percent in the fall of 2009, above the national peak at 10 percent. In some of the less-populous counties outside of the central city, the unemployment rate rose to about 15 percent.
Of the roughly 5,000 jobs lost during the recession in the MSA, slightly more than half were in the manufacturing sector (primarily auto and transportation industry components), with the other half spread across construction and the much larger service sector.
A Strong Recovery
The combination of stable housing prices and the recovery in auto sales has set the foundation for the strengthening of the local economy.
In other parts of the country, households have spent many years rebuilding their balance sheets due to losses in home equity resulting from falling home prices. Because prices in the region fell only slightly, the hit to households’ balance sheets in the area was less pronounced. Additionally, residential activity has picked up in recent months; however, limited inventories of homes for sale continue to stymie buyers. Construction activity remains focused on the multifamily sector. Given the current environment, some contacts noted that they began to see multiple offers on homes starting this spring.
With the rebound in auto sales, 2,000 manufacturing jobs have come back to the region. Coupled with continued job gains in the education and health care sector (1,800 jobs) and increases in the hospitality sector (1,400 jobs), total employment in Bowling Green has grown faster than the national growth rate and has surpassed the MSA’s prerecession peak. The region’s number of jobs is now about 4,000 higher than before the recession.
Employers’ concern about finding workers with needed skills may slow down job growth in the short term. As in other areas, any change in the national economy is also likely to be felt in the region. Nonetheless, contacts remain optimistic about growth prospects for Bowling Green, some noting that they have seen an increase in their customer base and others believing that the local economy seems to get better daily.
Figure 1

Figure 2
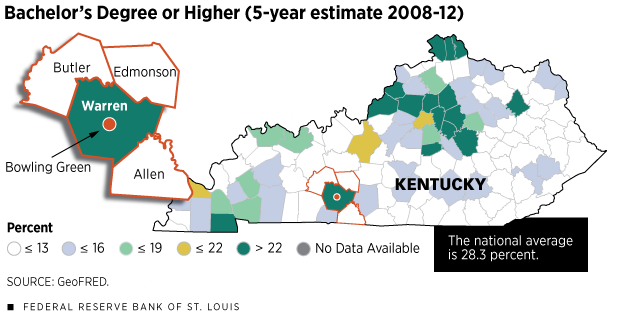
Figure 3

Figure 4
Endnotes
- The MSA, as defined in 2013, is made up of Allen, Butler, Edmonson and Warren counties. [back to text]
- Bowling Green ranks 248th out of 381 metropolitan areas based on population and 263rd out of 381 based on output, measured by gross metropolitan product. [back to text]
- Anecdotal information in this report was obtained from surveys and interviews with local business contacts in Bowling Green conducted by the authors. The anecdotes should be interpreted with caution because of the small sample of respondents. Some quotes were lightly edited to improve readability. [back to text]
- Economists Nathaniel Baum-Snow and Ronni Pavan have found a positive relationship between wages and city size: Workers in larger cities earn higher wages because they tend to be more productive, in part due to the additional resources afforded by larger cities. The authors found a 1 percent increase in wages for each additional 100,000 people in a metro area. [back to text]
- For perspective, the Louisville Slugger Museum in Louisville attracts about 550,000 visitors each year. [back to text]
- Percent of the population over 25 with a bachelor’s degree or higher: Warren (27.5); Allen (11.0) Edmonson (9.3); and Butler (7.5). [back to text]
Reference
Baum-Snow, Nathaniel; and Pavan, Ronni. “Understanding the City Size Wage Gap.” Review of Economic Studies, January 2012, Vol. 79, No. 1, pp. 88-127.

Views expressed in Regional Economist are not necessarily those of the St. Louis Fed or Federal Reserve System.
For the latest insights from our economists and other St. Louis Fed experts, visit On the Economy and subscribe.
Email Us