

District Overview: Mortgage Delinquency Rates in District Are Not As Bad As National Average
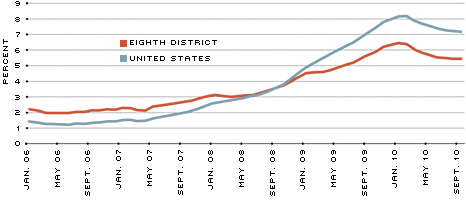
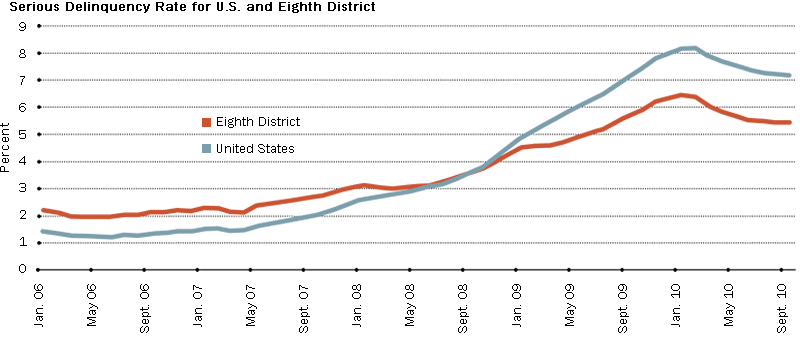
The mortgage crisis has been milder in the Eighth District than in the nation. As shown in Figure 1, the nation's serious delinquency (SD) rate surpassed that of the District in October 2008. The SD rate is defined as the sum of mortgages with payments over 90 days delinquent and of mortgages in the process of foreclosure, divided by the total number of mortgages serviced.1 The SD rate peaked at 8.2 percent for the nation during February 2010 and 6.5 percent for the District in January 2010.
Serious Delinquency Rates for U.S. and Eighth District
SOURCE: Authors' calculations based on data provided by LPS Applied Analytics.
NOTE: Aggregate rate for the Eighth District is calculated from the average of each county within the District's boundaries. The serious delinquency (SD) rate is equal to the sum of mortgages with payments over 90 days delinquent and mortgages in the process of foreclosure divided by the total number of mortgages serviced. Both figures include data for both prime and subprime first mortgages.
These respective levels are about four times the average rate (2.1 percent) for the nation and close to 2.5 times the average (2.7 percent) for the District over the three years leading up to the start of the recession.
SD rates began to decrease for the nation in March 2010 and for the District in February 2010. Since then, that trend has remained steady, despite leveling off in August and July 2010 for the nation and District, respectively. While the trend reversal is an important first step on the road to recovery, SD rates are still hovering at 7.2 percent and 5.4 percent for the nation and District, respectively. These rates amount to 3.5 and two times the prerecession averages for the nation and District, respectively.
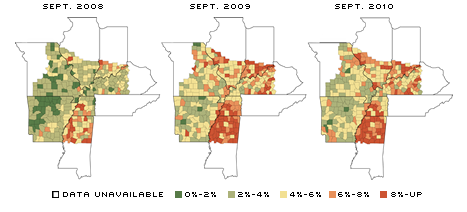
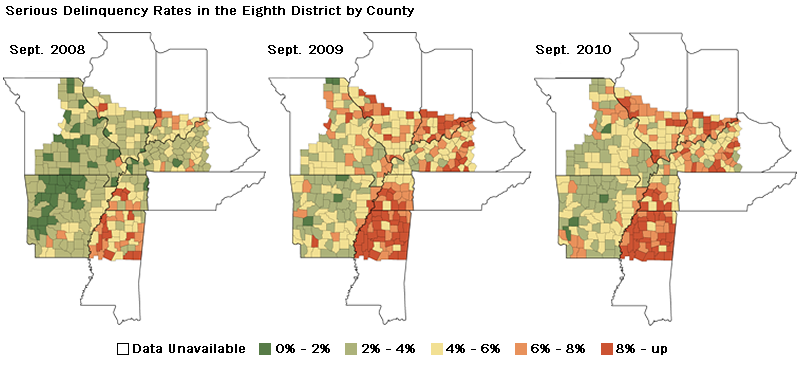
Within the District, there is significant variation of SD rates across geographic areas. The maps in Figure 2 show a county breakdown of SD rates for the portions of each state within the District. Clearly, Arkansas and Missouri are doing much better than the District portion of Mississippi, Illinois, Indiana, Kentucky and Tennessee. For example, Cleburne County, Ark. (1.8 percent SD rate, 6.4 percent unemployment), Osage County, Mo. (1.9 percent SD rate, 6.2 percent unemployment) and Schuyler County, Mo. (1.6 percent SD rate, 7.5 percent unemployment) were doing very well relative to the District as of September 2010.
Serious Delinquency Rates in the Eighth District by County
SOURCE: Authors' calculations based on data provided by LPS Applied Analytics.
Some of the counties that were the worst off, as of September 2010, are Holmes County, Miss. (16.8 percent SD rate, 17.4 percent unemployment), Winston County, Miss. (13.5 percent SD rate, 16.8 percent unemployment) and Noxubee County, Miss. (10.6 percent SD rate, 19.9 percent unemployment). Interestingly, the 2008 map shows that northern Mississippi, western Tennessee and southern Indiana had relatively higher SD rates even before the recession began.
A comparison between the 2009 and 2010 maps reveals that, while the SD rates have improved overall, the improvement has not been uniform across counties. For example, Monroe County, Ark., saw its SD rate increase from 3.4 percent in 2009 to 7.4 percent in 2010, while the SD rate for Clay County, Ill., jumped from 5.1 percent to 8.7 percent in the same time period.
Factors Affecting SD Rate
One important question that is relevant to policymakers is what factors contribute to the SD rate. The academic literature suggests that homeowner equity plays an important role in determining mortgage default rates.2 One widely used measure of homeowner equity is the loan-to-value (LTV) ratio, which is defined as the total mortgage amount divided by the appraised value of the property.
As the LTV ratio increases, borrowers might default on their mortgage for a number of reasons. For example, borrowers may have difficulty refinancing their mortgage or they may choose to default when the costs associated with defaulting plus the estimated value of the home are less than the mortgage amount. The mortgage crisis has been characterized by an 11.2 percent decline in national house prices from their peak in the first quarter of 2007. This decline translates to a considerably lower denominator in the LTV ratio, thus, increasing the probability of borrower default.
Fortunately, the District has fared better than the nation in the mortgage crisis, in part because the housing bubble was not as severe in the District from 2003-2006. Specifically, house prices in the District have declined by only 2.2 percent from their peak in the first quarter of 2008.3 This could be a factor that is contributing to the difference between aggregate SD rates for the nation and the District.
It is also reasonable to question whether macroeconomic effects, such as the unemployment situation, have a major impact on the SD rate. Without a steady income, homeowners find it increasingly difficult to make mortgage payments. Using 2008-10 annual unemployment rate data for counties within the District (as found in the St. Louis Fed's GeoFRED database), we find a positive correlation between the unemployment rate and SD rate. However, when we analyze the year-over-year changes in the two rates for 2009-10 and 2008-09, we find that there is little correlation between the changes in these rates. These findings suggest careful econometric analysis is necessary before we can come to any definitive conclusion on the role that unemployment may play in affecting the SD rate in the District.
Will Recovery Continue?
Overall, the distribution of SD rates in the District shows signs of a nascent recovery in the housing market. However, with a slowdown of the downward movement in SD rates for the District and the nation as a whole, there is cause for concern.
Furthermore, the signs of recovery are not applicable to all locales; several counties in the District are experiencing increasing SD rates, while others have had relatively little change. Therefore, a sustained recovery in the District's housing market is, to borrow a parlance from politics, too close to call.
Endnotes
- Figures are for both prime and subprime loans. [back to text]
- See Krainer and LeRoy. [back to text]
- Based on the average of the quarterly Federal Housing Finance Agency (FHFA) house price index for all metropolitan statistical areas located entirely within the District. [back to text]
References
Krainer, John; and LeRoy, Stephen. "Underwater Mortgages." Federal Reserve Bank of San Francisco Economic Letter, Oct. 18, 2010, No. 31.


Views expressed in Regional Economist are not necessarily those of the St. Louis Fed or Federal Reserve System.
For the latest insights from our economists and other St. Louis Fed experts, visit On the Economy and subscribe.
Email Us
