


How COVID-19 Has Affected the Municipal Bond Market
KEY TAKEAWAYS
- While the COVID-19 pandemic has touched all parts of the national and world economies, it has affected the U.S. municipal bond market on a few different fronts.
- In March, municipal bond yields increased sharply, as investors found them less desirable. Once the Fed offered to accept bonds as collateral for certain loans, yields decreased.
- The hit to the market is believed to be related to COVID-19 expenditures such as unemployment aid, the extended tax-filing deadline and a lack of liquidity.

While the entire economy is suffering because of the COVID-19 pandemic, a sector hit particularly hard has been the municipal bond market. A delayed tax-filing deadline, increased spending in response to the virus and a general lack of liquidity have all contributed to the market’s challenges. This article revisits the main features of the market and analyzes the distress it suffered during the early months of 2020.
The Municipal Bond Market
In the U.S., different local governments issue bonds in the municipal bond market. A large variety of local institutions participate, including states, counties and cities, other municipalities, school districts, and many others.
For this article, we constructed a data set on June 9, 2020, using 57,401 municipal bonds from the Refinitiv Eikon database. It includes all bonds already issued in 2020 or with planned issuance this year, as of the above date. As a result, our information certainly does not cover all the issuances for 2020—since municipalities will still be able to issue bonds throughout the year—but it serves as a snapshot of market conditions.
The bonds in our data set accumulate to a total outstanding amount of slightly more than $200 billion. In previous years, issuances in this market were more than twice this amount. We also use data on bonds issued in 2019 compiled by the Municipal Securities Rulemaking Board (MSRB). The data give the value in billions of all bonds issued in each state in 2019. The table below shows the percentages of the amounts issued or planned to be issued for 2020 by purpose.The amount outstanding was replaced with zero for 2,081 bonds with missing information.
The largest category is general purpose or public improvements, with more than 25% of the amount issued. Education-related bonds are in the second and third categories, with primary and secondary education having almost 19% of the amount issued and higher education slightly more than 8%.
Health care has two categories—hospitals and other health care, which includes nursing homes. When added together, the health care sector reached 11% of the amount issued in 2020. Altogether, these five categories account for nearly 64% of amounts outstanding for 2020. Other interesting categories include public health initiatives such as water and sewer funding and pollution control; infrastructure projects such as airports, mass and rapid transit, and housing; and gas and other utilities.
| Purpose | Percent of Amount Outstanding |
|---|---|
| General Purpose/Public Improvements | 25.58 |
| Primary/Secondary Education | 18.95 |
| Higher Education | 8.29 |
| Other Health Care | 7.70 |
| Water and Sewer | 7.26 |
| Mass/Rapid Transit | 4.35 |
| Single and Multi-Family Housing | 3.71 |
| Hospitals | 3.32 |
| Toll Roads/Streets/Highways | 2.74 |
| Electric and Public Power | 2.41 |
| Other Transportation | 2.00 |
| Pension Funding/Retirement | 1.62 |
| Combined Utilities | 1.30 |
| Gas | 1.29 |
| Economic Development | 1.11 |
| Airports | 1.04 |
| Pollution Control | 0.88 |
| Government/Public Buildings | 0.82 |
| Other | 5.62 |
| SOURCES: Refinitiv Eikon data and authors’ calculations. | |
| NOTES: Numbers do not equal 100 due to rounding. | |
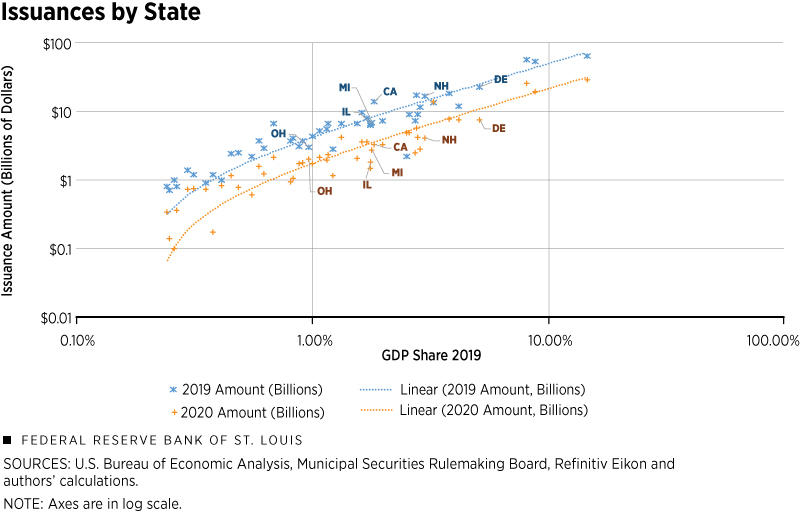
The picture of the municipal bond market is not complete if we do not understand the most important states in this market. In Figure 1, we grouped all bonds at the state level and plotted them against their share of gross domestic product (GDP). For simplicity, we reference just the state for which a bond was issued. Still, it should be noted that a portion of bonds are issued by entities within the states and not the states themselves.
Snapshot of Current Activity
When looking at the differences between 2019 and 2020 issuances, it is essential to note that the 2019 data account for the entire universe of municipal bonds. In contrast, the 2020 data account for bonds already issued or planned to be issued as of June 9, 2020.
As discussed above, states may issue more bonds than those currently in the data set by the end of the year; thus, the 2020 numbers represent a lower bound of issuance for each state for this year. There is a tight relationship between the share of GDP and the amount of debt issued for 2019 and 2020. This relationship means states with higher shares of total GDP also have more copious amounts of debt in the form of municipal bonds.
Large states such as California, Texas and New York have high shares of GDP and total debt amounts. States with small populations such as Alaska and South Dakota have lower shares of GDP and lower amounts of bond debt, especially this year. Overall, less total debt has been issued thus far in 2020 than in 2019. The share of total debt issued for each year is consistent for a handful of states, such as California, New York, Louisiana, New Hampshire, Arkansas and Pennsylvania.
For example, California issued 14.1% of the total amount for 2019 and 14.2% of the total amount for 2020. The state with the most significant change in debt percentage from 2019 to 2020 is Ohio, where the percentage share of total bond debt increased by approximately 4 percentage points from 2019 to 2020.
Last year, Michigan issued $2.2 billion worth of bonds, which was well below the bond amount to GDP trend line for 2019. The state has already surpassed that amount of debt for 2020, with $4.87 billion in bonds issued this year. Similarly, Illinois also fell below the trend line last year in the amount of debt issued. However, this year Illinois falls on the trend line, and it is the first (and, thus far, only) state to announce plans to use the Municipal Liquidity Facility (MLF), a Federal Reserve initiative to provide up to $500 billion in credit to state and local goverments whose revenues have dropped during the pandemic.
States that show some other interesting patterns are Ohio, New Hampshire and Delaware. Each of these has already issued nearly the same amount of debt as in all of 2019. There are a couple of possible explanations for this. These states may issue or plan to issue most of their debt at the beginning of the year, or they may be issuing more debt in 2020 than in 2019.
Bonds of different maturities are associated with different uses. Most bonds are issued to pay for long-term projects such as building schools, roads, hospitals and other large public infrastructures. Issuing bonds to finance these public works projects allows municipalities to spread the cost over many years. For example, the Ladue School District in suburban St. Louis issued approximately $82 million in bonds of varying maturities and amounts throughout 2016 to finance renovations to Ladue Horton Watkins High School. The maturities ranged from five years to 20, with an average maturity of 12.5 years.Numbers from authors’ calculations based on Refinitiv Eikon data.
A maturity of this size is not uncommon; the maturities of bonds issued to pay for public projects are long and can reach up to 40 years. Higher taxes, tolls or fares paid by the project’s future users pay for the service of the debt. Short-term bonds can also be issued to pay for things such as smoothing uneven cash flows (borrowing against future tax revenue). Examples of these bonds include tax anticipation notes (TANS), bond anticipation notes (BANs) and revenue anticipation notes (RANs), among others.
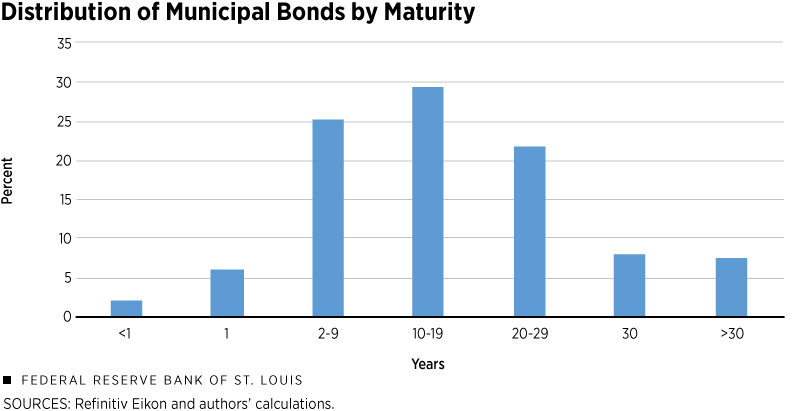
Using our data set of bonds issued in 2020, we computed the distribution of bonds by maturity and present it in Figure 2. The maturity of municipal debt is long. The share of the total amount of debt that equates to one year of maturity or less is 8.4%, and only one-third of the debt matures in less than 10 years. The average maturity is 16 years, and the median is slightly lower (14.5 years).
Bonds in Emerging Markets
By comparison, using sovereign bonds for several emerging-market economies, a 2018 paper by economists Maximiliano Dvorkin, Juan Sánchez, Horacio Sapriza and Emircan Yurdagul reports an average maturity of 7.7 years. The comparison with sovereign debt from emerging markets is relevant because, presumably, both markets pay a premium due to the risk of default.
Since emerging markets pay a high risk premium on long-term debt, short-term debt is a more attractive option. Additionally, sovereign debt is usually issued to finance persistent fiscal deficits rather than infrastructure projects. Compared with the sovereign bonds of emerging markets, the difference in maturities suggests municipal bonds are used more heavily to finance long-term infrastructure projects. Indeed, 2019 work by Dario Cestau, Burton Hollifield, Dan Li and Norman Schürhoff reports that states and local governments funded approximately 72% of infrastructure projects with municipal bond issues between 2007 and 2016.
Defaults in the municipal bond market are infrequent but have occurred. Most defaults occur among non-general obligation bonds. The issuer can default with or without filing for bankruptcy. Among the most massive defaults in the United States were Alabama’s Jefferson County defaulting on more than $3 billion in 2008 and the city of Detroit defaulting on $18 billion to $20 billion in 2013.
Currently, Puerto Rico plans to restructure $35 billion in municipal debt, but this has been delayed because of COVID-19. The restructuring will turn $35 billion in debt into $11 billion in bonds with up to 30-year maturities. Debt restructuring is a way in which the issuer can pay the original bond holders a portion of their investments after defaulting. The issuer, in this case Puerto Rico, will pay the newly agreed amount in manageable increments over the period of the new maturity. By comparison, on Dec. 26, 2001, Argentina defaulted on the country’s $132 billion debt. This illustrates that sovereign debt defaults can be much larger than municipal defaults.
Finally, a particular feature of this market is that state and local governments typically have income tax exemptions for interest earnings on bonds issued by that state or locality. Tax exemptions allow municipalities to borrow at lower interest rates than corporations. In our data set of bonds issued or planned to be issued in 2020, 88% of the bonds and 76.5% of the amount of debt are exempt from federal tax.
Municipal bonds that are not tax-exempt sometimes have other benefits provided by the federal government. For instance, in the case of the Build America Bonds authorized in 2009 under the American Recovery and Reinvestment Act, the federal government subsidizes 35% of the interest payments. In the case of tax credit bonds, such as Qualified Zone Academy Bonds or Clean Renewable Energy Bonds, bondholders receive federal income tax credits instead of interest payments.
COVID-19 and the Fed’s Response
When a municipal bond is traded in the secondary market, the price of the transaction is recorded and the yield to maturity is computed. The yield to maturity, or merely the yield, is the return that someone buying the bond today is expected to obtain if the bond is held until maturity. There are different options for investing in the municipal bond market:
- Bonds can be purchased individually.
- A mutual fund can purchase many bonds, and investors can buy shares of that fund.
- Investors can buy bond exchange-traded funds (ETFs), a basket of securities that tracks an underlying index.
Since many investors deal with mutual funds or ETFs in the municipal bond market, rather than individual bonds, indexes of these portfolios are good market indicators. To analyze yields, in the rest of this section, we use Standard & Poor’s (S&P) indexes. These indexes include tax-exempt bonds with a minimum of $2 million and a minimum term to maturity greater than one calendar month. The bonds included here also have a minimum rating of BBB- in S&P or the equivalent in other credit rating agencies.
Figure 3 displays the evolution of some critical indexes. The blue line is an index that approximates the performance of the entire municipal bond market. As is shown in the figure, starting on March 9, the yield increased sharply. An increase in yields meant these bonds became less desirable, as the price at which investors were willing to buy them decreased. What happened? A Federal Reserve Bank of New York report explains the tax-filing deadline had been moved from April 15 to July 15, affecting states and cities that rely on income taxes for revenue.
For instance, New York receives a large portion of revenue from capital gains taxes, which are paid when individuals file income taxes. The official announcement of the changed deadline occurred on March 21, but there were expectations for the extension throughout March. The concentration of this revenue on a particular date contrasts with revenue from taxing salaries and wages, usually taken from wages throughout the year.
State and local governments have also increased expenditures on health services and unemployment benefits due to the impacts of COVID-19, adding a further burden to their balance sheets. However, an analysis from the Federal Reserve Bank of Kansas City suggests that the initial spike in municipal bond yields was probably due to illiquidity in the municipal bond market. The reason is that the rise in yields in the municipal bond market was not associated with state-specific credit risk. However, the same report notes that credit risk issues such as the ones listed above could cause concerns in the market moving forward.
The distress in the market continued until March 20, when the Federal Reserve announced it would accept municipal bonds as collateral on loans to money market mutual funds. The reaction was swift. In the following days, yields returned to levels that were only slightly above pre-pandemic values. The following weeks, the Fed made other announcements that also helped calm the market.
On April 9, the Fed announced a Municipal Liquidity Facility, which would buy newly issued bonds with the ability to purchase up to $500 billion from an eligible issuer. An eligible issuer must have been rated at least BBB- as of April 8, 2020, by two or more major nationally recognized statistical rating organizations and meet minimum city or county population requirements. Because the initial constraints on eligibility were excluding some areas in trouble, additional announcements made on April 27 and June 3 expanded the set of local governments that would have access to the MLF.
Figure 3 also shows indexes for some selected states and sectors. The orange line is the average of indexes for states with a high incidence of COVID-19 (Colorado, Connecticut, Georgia, Illinois, Louisiana, New Jersey and New York). Although the pattern is similar to the broader index (blue line), the yield is slightly higher after the first week of March.
Thus, we can see that the number of infections impacted municipal bond yields, but the effect seems small. An analysis from the Federal Reserve Bank of St. Louis shows that areas with more infections are also areas where households were previously experiencing financial distress. Thus, this finding suggests municipalities and households in areas with more COVID-19 infections face higher financial distress.
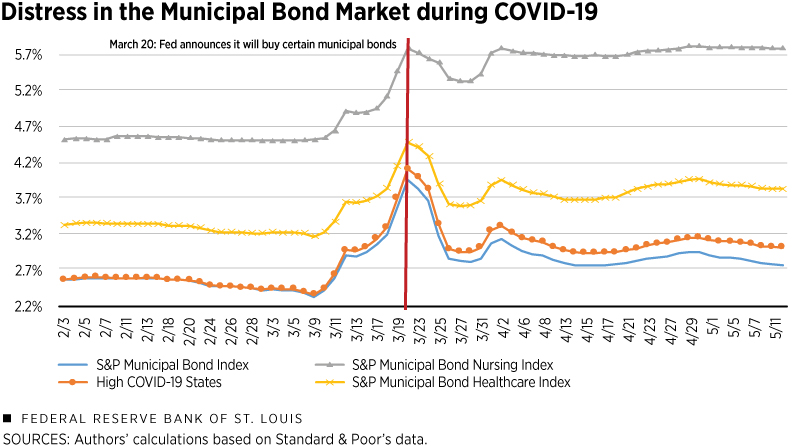
The effect of the MLF was not uniform across sectors. We also included in Figure 3 indexes for two sectors that were affected during this period. The S&P Municipal Bond Health Care Index, represented by the yellow line, consists of bonds in the S&P Municipal Bond Index from the hospital, life care, nursing home, and other health care sectors. The S&P Municipal Bond Nursing Index, represented with a gray line, consists of bonds in the S&P Municipal Bond Index from the nursing sector. Both indexes were above the broader index even before the pandemic. However, the effect of the Fed announcement seems different. It is apparent in the case of the nursing sector’s index that a week after the announcement, the yields returned to their maximum value.
Conclusions
The municipal bond market is an essential area of the financial sector routinely used to finance local governments in the U.S. These bonds finance long-term projects and, in some situations, smooth fluctuations in tax revenues.
During the COVID-19 pandemic, the market had a period of high distress between March 9 and 20 related to:
- Investors’ doubts about the revenues of municipalities after the delay in the deadline to submit taxes
- The increased state and local expenditures as a result of COVID-19
- Municipal bond market illiquidity
The Fed intervened, extending credit to municipalities that met certain conditions, and most of the market returned to the level of yield above but similar to that before the crisis. Some states and, most predominantly, some health care sectors, continued to face elevated levels of distress through May.


Views expressed in Regional Economist are not necessarily those of the St. Louis Fed or Federal Reserve System.
For the latest insights from our economists and other St. Louis Fed experts, visit On the Economy and subscribe.
Email Us