


The Role of Industry Mix in Regional Business Cycles
KEY TAKEAWAYS
- The business cycles of individual U.S. states can diverge from the national cycle. Industry mix within those states can help explain why this may happen.
- Certain industries, like construction, tend to be the more responsive to national expansions and recessions. Other sectors, like government, are less responsive.
- Understanding how differences in industry composition affect regional business cycles may help local leaders better tailor their policies to downturns and expansions.

The U.S. has been in an economic expansion for more than 10 years, adding over 21 million workers to payrolls since June 2009 and seeing a 2.3% average annualized increase in real gross domestic product (GDP) each quarter. The expansion was preceded by a recession that lasted from December 2007 to June 2009, during which time over 7 million workers were dropped from payrolls and real GDP fell by an average annualized rate of 2.6% each quarter. Expansions and recessions like these are two stages of what economists call the business cycle, which is often marked by coinciding movements in economic indicators like employment and GDP.The National Bureau of Economic Research (NBER) researches and establishes exactly when the peaks and troughs of a business cycle in the U.S. have occurred. For example, the NBER determined that a trough in business activity occurred in June 2009, marking the end of the Great Recession and the beginning of the subsequent expansionary period.
While the nationwide business cycle is important, the U.S. is not a uniform country, and research has shown that different regions have varying business cycles. Economists Michael Owyang, Jeremy Piger and Howard Wall found that U.S. states experience significantly different growth rates, and sometimes they may not even be in the same phase of the business cycle as each other at the same time. The authors found that some states, like Maryland in the mid-1990s, fell into a recession not connected at all with a national recession. Other states were in recession months before the national economy reached that stage, or remained in a recession long after the nation entered an expansionary phase. Missouri, for example, switched into a recession in August 2000, seven months prior to the start of a national recession.
State Business Cycles and Industry Mix
A basic way to measure the movements of state business cycles in relation to the national cycle is to see how a change in U.S. GDP or U.S. employment would affect each state. Figure 1 shows the relation between a change in U.S. real GDP and each state’s employment levels.
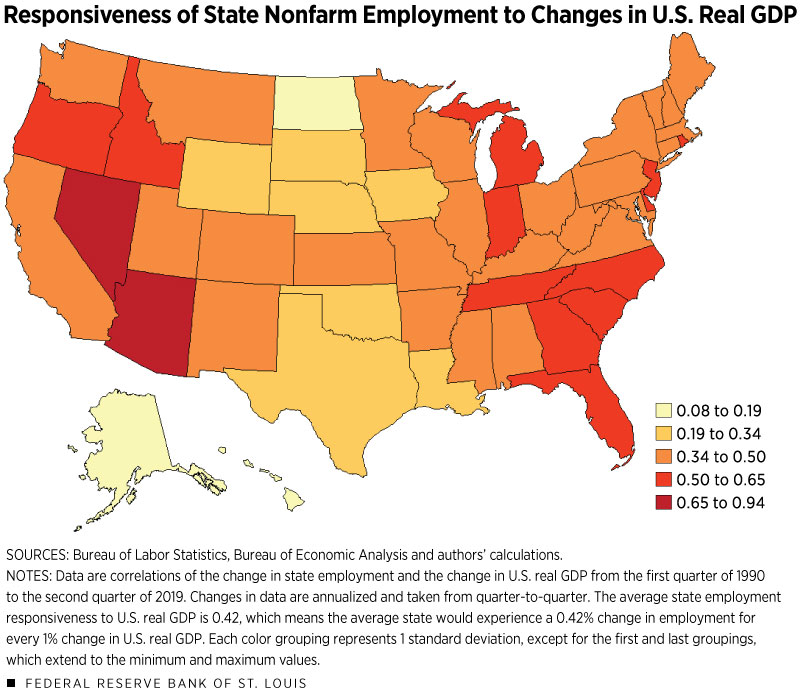
States whose employment levels fluctuate more when overall GDP changes will appear as more sensitive or responsive to the national cycle. For example, when U.S. real GDP has changed by 1%, Nevada has seen an average change in employment that is double the national average change in employment.Since 1990, Nevada has seen an employment change of 0.93% for every 1% percent change in U.S. GDP, while the U.S. in aggregate has seen an employment change of 0.45% for every percent change in U.S. GDP. Nevada far outpaces the next most responsive state, Arizona, which has a responsiveness of 0.695%. Nevada employs over 25% of its workers in the leisure and hospitality industry, well above the national average of 11%. While this industry is not very responsive to U.S. GDP on a national level, local conditions in this industry could make this industry more responsive on a state level. Nevada leisure and hospitality changes by 0.91% for each percent change in U.S. GDP, while the national level of this industry changes by only 0.35%. The District of Columbia, by comparison, has seen an employment change less than one-fifth the national average for every 1% change in U.S. real GDP. Some states in the western and southeastern parts of the country have higher rates of sensitivity to the national business cycle, while many states in the Great Plains seem to be less sensitive.The employment levels for every state were positively correlated with national GDP and employment, indicating the importance of the national business cycle when looking at state business cycles.
One component driving these differences in regional business cycles could be the types of jobs available in a given area.
Certain industries are more sensitive to economic expansions and recessions. Because industries often cluster by geography, there is potential for disparities in employment growth between areas with different industry makeups. For example, states with higher employment rates in the energy industry, like Texas, will react differently to oil price shocks than other states, which can result in these states being out of sync with the national economy. According to a 2016 study by Maria Arias, Charles Gascon and David Rapach, the technology hubs of San Francisco and San Jose suffered relatively severe recessions in the early 2000s after the dot-com bubble burst, while other California metro areas like Riverside and Sacramento avoided recessions altogether during that period.
The accompanying table gives a simple measure of the sensitivity or responsiveness of certain industries to the national business cycle for the 1990-2019 period. Industries whose employment levels fluctuate more when overall GDP changes correspond to higher sensitivity numbers. When U.S. real GDP changes by 1%, U.S. construction employment changes by 1.4% on average, while government employment sees a much smaller change of 0.1%.
| Responsiveness to Change in U.S. Real GDP | Responsiveness to Change in Total U.S. Employment | Percentage of Total U.S. Nonfarm Employment (2019:Q3) | |
| Construction | 1.4 | 3.0 | 5.0 |
| Professional and Business Services | 0.9 | 1.8 | 14.2 |
| Manufacturing | 0.7 | 1.8 | 8.5 |
| Information | 0.6 | 1.5 | 1.9 |
| Transportation and Warehousing | 0.5 | 1.5 | 3.7 |
| Wholesale Trade | 0.5 | 1.2 | 3.9 |
| Retail Trade | 0.5 | 1.1 | 10.4 |
| Total Nonfarm | 0.4 | 1.0 | 100.0 |
| Financial Activities | 0.4 | 0.8 | 5.7 |
| Leisure and Hospitality | 0.4 | 0.9 | 11.0 |
| Mining and Logging | 0.3 | 1.1 | 0.5 |
| Other Services | 0.2 | 0.6 | 3.9 |
| Government | 0.1 | 0.1 | 14.9 |
| Education and Health Services | 0.0 | 0.0 | 16.1 |
| Utilities | –0.2 | –0.2 | 0.4 |
SOURCES: Bureau of Labor Statistics, Bureau of Economic Analysis and authors’ calculations.
NOTES: The first column indicates the change in employment in an industry that correlates to a percent change in U.S. real GDP from 1990 to 2019. For example, construction employment will average a 1.4% change for every 1% change in U.S. GDP. The second column indicates the response of industry employment to a 1% change in total U.S. nonfarm employment for the same time period. The third column is the percentage of total nonfarm employment for the given industry. Changes in employment and GDP are annualized and are quarterly-to-quarterly.
Since 1990, U.S. employment in construction, professional and business services,The professional and business services sector includes areas such as business and legal support services, temporary-help services, office administrators, building services workers, management workers, and other professional and support services. and manufacturing tends to be the most responsive to national expansions and recessions. Meanwhile, employment in government, education and health care, and utilities tends to be the least responsive to U.S. expansions and recessions.
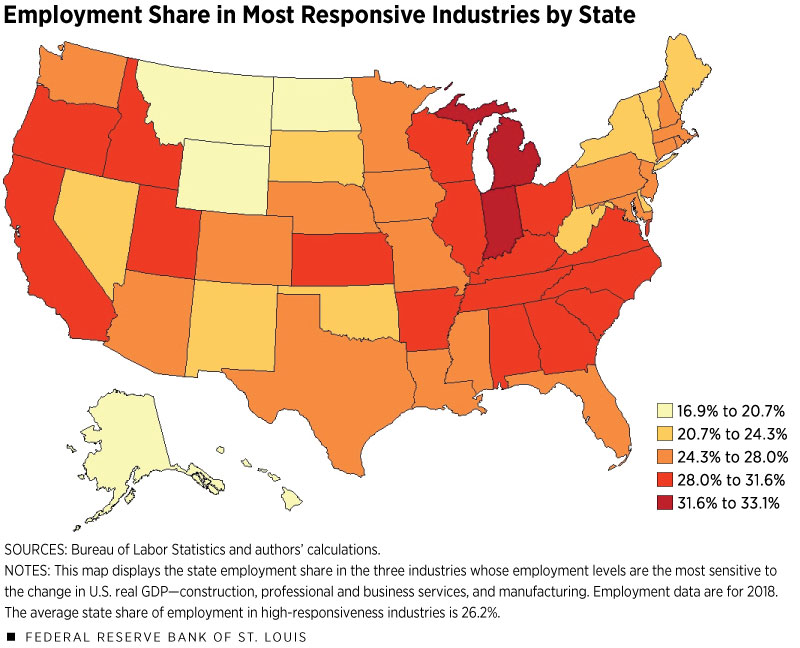
Because states have different industry mixes, they will have different employment levels in the more cycle-sensitive industries. Figure 2 displays the percentage of state employment in the three most sensitive industries: construction, professional and business services, and manufacturing. In Michigan, these three industries make up about 33% of all employment, while they employ only 17% of workers in Alaska. Many states located in the eastern part of the Midwest and southeastern parts of the U.S. have relatively high employment shares in these sensitive industries.
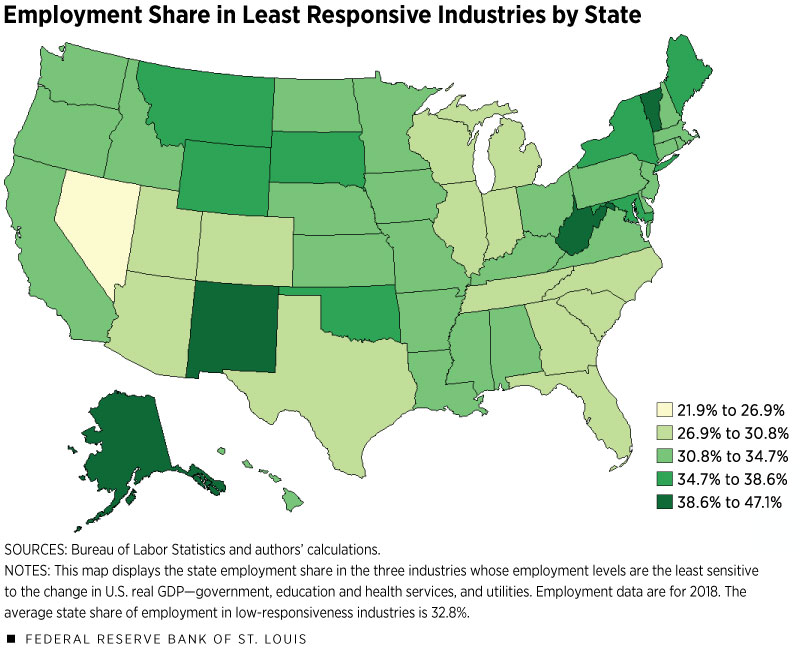
Conversely, some states have higher employment levels in low-sensitivity industries. Figure 3 displays the percentage of state employment in the three least sensitive areas: government, education and health services, and utilities. Many Northeastern states have high employment shares in less sensitive industries, which may subdue these states’ responses to fluctuations in national economic conditions. Nevada has the lowest level of low-sensitivity employment in the U.S., which might have been one factor in why its sensitivity rate in Figure 1 is so high.
Taken together, the employment shares of high-sensitivity and low-sensitivity industries explain about half of the variation in state responsiveness to changes in U.S. real GDP,This value was obtained from the adjusted R2 of a regression of annualized change in U.S. real GDP on employment shares in the three highest-sensitivity and lowest-sensitivity industries. indicating that industry mix can play a significant part in how states move with the national business cycle.
A Closer Look at the Eighth District
The Eighth Federal Reserve DistrictHeadquartered in St. Louis, the Eighth Federal Reserve District includes all of Arkansas and parts of Illinois, Indiana, Kentucky, Mississippi, Missouri and Tennessee. has a few states with relatively higher sensitivities—Indiana, Kentucky and Tennessee are all above the national level of employment sensitivity to GDP changes. Arkansas, the least sensitive state in the District to the business cycle, is about 16% less sensitive to U.S. real GDP than the national average in aggregate.
The share of manufacturing employment in Indiana, Kentucky and Tennessee may help explain their elevated sensitivity levels. Indiana employs 17.2% of its workers in manufacturing, which is more than double the national level of 8.5%, while Kentucky and Tennessee have manufacturing employment shares of 13.1% and 11.5%, respectively. While these three states have relatively high employment shares in this highly sensitive industry, none have a combined employment share in the lowest-sensitivity industries above the national level, which may have furthered the cycle sensitivity of these states.
Conclusion
There are significant differences in the makeup of employment by industry across the U.S. Some states will have much of their economy based in highly sensitive industries like construction, professional and business services, and manufacturing. Other states will rely more on less sensitive industries, with more workers in government, education and health services, and utilities.
It is useful to understand how these differences in industry mix affect regional business cycles, especially when trying to determine which areas may need the most support during recessions or which areas will experience more growth during expansions. Employment shares in high-sensitivity and low-sensitivity industries can help explain some, but not all, of the variation in state business cycles and their relation to the national cycle.
Understanding the industry mix in an area is just one step to being more cognizant of the diversity of the U.S. and its economic composition. The correlative analysis done here provides a basic understanding of business cycle responsiveness but fails to account for other economic factors. Regions have different education levels, housing supply characteristics, urban population shares and establishment sizes—all of which can affect their local business cycle or comovement with the national cycle.This is according to the 2016 study by Maria Arias, Charles Gascon and David Rapach, as well as a 2009 study by Michael Owyang, David Rapach and Howard Wall. Additionally, certain state economies and business industries will influence the national GDP trends more than others because of how large they are, causing a reciprocal relationship between state employment and U.S. GDP and potentially biasing our correlative results. For example, a downfall in the California economy has a high likelihood of affecting overall U.S. GDP simply because of how large the GDP and population of the state are, which would lead to a higher sensitivity measurement.
Endnotes
- The National Bureau of Economic Research (NBER) researches and establishes exactly when the peaks and troughs of a business cycle in the U.S. have occurred. For example, the NBER determined that a trough in business activity occurred in June 2009, marking the end of the Great Recession and the beginning of the subsequent expansionary period.
- Since 1990, Nevada has seen an employment change of 0.93% for every 1% percent change in U.S. GDP, while the U.S. in aggregate has seen an employment change of 0.45% for every percent change in U.S. GDP. Nevada far outpaces the next most responsive state, Arizona, which has a responsiveness of 0.695%. Nevada employs over 25% of its workers in the leisure and hospitality industry, well above the national average of 11%. While this industry is not very responsive to U.S. GDP on a national level, local conditions in this industry could make this industry more responsive on a state level. Nevada leisure and hospitality changes by 0.91% for each percent change in U.S. GDP, while the national level of this industry changes by only 0.35%.
- The employment levels for every state were positively correlated with national GDP and employment, indicating the importance of the national business cycle when looking at state business cycles.
- The professional and business services sector includes areas such as business and legal support services, temporary-help services, office administrators, building services workers, management workers, and other professional and support services.
- This value was obtained from the adjusted R2 of a regression of annualized change in U.S. real GDP on employment shares in the three highest-sensitivity and lowest-sensitivity industries.
- Headquartered in St. Louis, the Eighth Federal Reserve District includes all of Arkansas and parts of Illinois, Indiana, Kentucky, Mississippi, Missouri and Tennessee.
- This is according to the 2016 study by Maria Arias, Charles Gascon and David Rapach, as well as a 2009 study by Michael Owyang, David Rapach and Howard Wall. Additionally, certain state economies and business industries will influence the national GDP trends more than others because of how large they are, causing a reciprocal relationship between state employment and U.S. GDP and potentially biasing our correlative results. For example, a downfall in the California economy has a high likelihood of affecting overall U.S. GDP simply because of how large the GDP and population of the state are, which would lead to a higher sensitivity measurement.
References
Arias, Maria A.; Gascon, Charles S.; and Rapach, David E. “Metro Business Cycles.” Journal of Urban Economics, July 2016, Vol. 94, pp. 90–108.
Owyang, Michael T.; Piger, Jeremy; and Wall, Howard J. “Business Cycle Phases in U.S. States.” The Review of Economics and Statistics, November 2005, Vol. 87, No. 4, pp. 604–16.
Owyang, Michael T.; Rapach, David E.; and Wall, Howard J. “States and the Business Cycle.” Journal of Urban Economics, March 2009, Vol. 65, No. 2, pp. 181–94.


Views expressed in Regional Economist are not necessarily those of the St. Louis Fed or Federal Reserve System.
For the latest insights from our economists and other St. Louis Fed experts, visit On the Economy and subscribe.
Email Us