


Health Care Remains Important Job Engine in Eighth District
KEY TAKEAWAYS
- While the output share is relatively small, health care comprises about 22 percent of household spending, up from 10 percent in the 1970s.
- The health care sector has generated about 30 percent of new jobs nationally since 2007, and 50 percent of new jobs in the Eighth District.
- Not all jobs in health care are high-pay. One-third of workers are in health care support occupations that pay below the average prime sector wage.

As the U.S. population has aged, the health care sector has become one of the fastest-growing parts of the economy, causing a surge in new job openings. Even technology companies are finding ways to expand into the health care space, with products such as wearable medical devices and the use of 3-D printing to manufacture health care products. With all the challenges and opportunities that exist, it is worth taking a closer look into the health care sector.
Size of the Health Care Sector
The economic size of the sector can be measured in various ways. Depending on the measure, the sector could be as small as one-tenth of the economy or as large as one-quarter of the economy.
The first stage in measuring the size is determining which industries should be included in the sector. A narrow definition focuses on health care service-providing firms, such as doctors’ offices, hospitals and nursing homes.1 Nationally, about 12 percent of the workforce is employed in these industries.
However, there are other industries often included in the definition, such as drug manufacturers, pharmacies and insurance companies.2 Including these increases the share of employment to about 14 percent. Table 1 highlights the largest firms in each of these industries. Due to data availability, this article will primarily rely on the narrower definition of the sector to provide consistency across various metrics.
Largest Health Care Firms by Industry
| NAICS Code | Industry Name | National | Eighth District |
|---|---|---|---|
| 3254 | Pharmaceutical and Medicine Manufacturing | Johnson & Johnson | Reliv International Inc. |
| 44611 | Drug Stores and Pharmacies | CVS Health Corp. | Express Scripts Holding Co. |
| 52411 | Life and Health Insurance Carriers | UnitedHealth Group Inc. | Centene Corp. |
| 621 | Ambulatory Health Care Services | Humana Inc. | Humana Inc. |
| 622 | Hospitals | HCA Healthcare Inc. | BJC HealthCare |
| 623 | Nursing and Residential Care Facilities | Kindred Healthcare Inc. | Kindred Healthcare Inc. |
SOURCES: Compustat, Dow Jones.
NOTES: The Eighth Federal Reserve District is headquartered in St. Louis. The District includes all of Arkansas and parts of Illinois, Indiana, Kentucky, Mississippi, Missouri and Tennessee.
Providing health care services is generally more labor-intensive than other sectors of the economy, such as manufacturing. As a result, the share of national output (or value added) derived from the health care sector is about 7 percent, which is considerably smaller than the share of employment. However, household consumption of health goods and services is notably higher, at around 22 percent of all household spending, of which 16 percent is health care services and the rest going to goods such as drugs or medical devices.
With relatively fast growth in health care prices during the past few decades, the share of households’ expenditures on health care has increased from 10 percent in the early 1970s. The share of spending on pharmaceutical products has more than doubled, from 1.1 percent in 1970 to 3.8 percent in 2016, but remains a relatively small component of overall household spending. While an aging population will demand more health care services, technological improvements and better overall health outcomes could offset some increased spending.
Strong Growth in Employment
Growth in the health care sector has been a key driver of employment growth in the past decade. Since 2007, the U.S. economy has added about 9.7 million jobs. During this same period, the health care sector added just over 3 million jobs, which breaks down to about 1 million during the recession and another 2 million after the recession. (See Figure 1.)
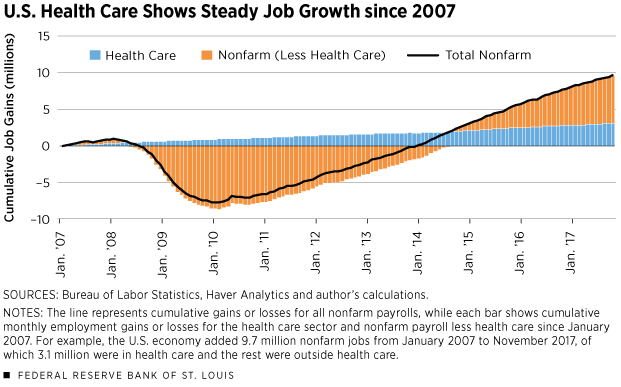
In total, gains in the health care sector over this period account for about 32 percent of new employment, which is impressive considering the sector employed only 9 percent of the workforce in 2007. Among the three major industries in health care (according to our narrow definition, as seen in Endnote 1), the ambulatory care service industry (e.g., doctor offices, dentist offices, outpatient centers) added over 2 million of the new jobs.
Job growth in the health care sector has created a wide variety of jobs beyond the typical occupations of doctors or nurses. In fact, only about 60 percent of people employed in the health care sector work in health care occupations. The other 40 percent are in areas such as office or administrative work, personal care, food preparation, and community and social services.
Jobs Openings to Remain High
Building off the distinction between the health care sector and health care occupations can provide some useful insights about the industry and the outlook.
The two major health care occupational groups are: (1) health care practitioners and technical occupations, and (2) health care support occupations. The former group predominantly includes physicians, specialists, pharmacists and registered nurses. Of the 8 million people in this group, the biggest subset is registered nurses, at over 2.8 million. Health care support occupations are predominantly nursing assistants, home health aides and medical assistants.
Table 2 summarizes the employment and wage profiles of these two subsets of workers. Notice that 8.8 percent of the U.S. workforce is employed in health care occupations, of which two-thirds are practitioners and the rest are in support occupations. Health care practitioners earn an average wage of $38 an hour, which is about 60 percent higher than the average private sector wage. On the other hand, support occupations earn an average of $15 an hour, or 40 percent below the average private sector wage.
Health Care Jobs and Pay: 2016
| U.S. | Eighth District | Little Rock | Louisville | Memphis | St. Louis | |
|---|---|---|---|---|---|---|
| Share of Workforce in Health Care Occupations | 8.8% | 9.6% | 11.3% | 9.2% | 9.2% | 9.5% |
| Health Care Practitioners and Technical Occupations | 5.9% | 6.8% | 8.2% | 6.7% | 6.8% | 6.6% |
| Health Care Support Occupations | 2.9% | 2.8% | 3.1% | 2.5% | 2.4% | 3.0% |
| Average Hourly Wage for all Private Sector Workers | $23.86 | $21.24 | $20.70 | $21.28 | $20.64 | $23.19 |
| Average Hourly Wage for all Health Care Occupations | 30.40 | 27.98 | 27.49 | 29.40 | 29.91 | 27.40 |
| Health Care Practitioners and Technical Occupations | 38.06 | 33.87 | 32.71 | 34.82 | 35.66 | 33.60 |
| Health Care Support Occupations | 14.65 | 13.64 | 13.40 | 14.86 | 13.59 | 13.68 |
SOURCE: Occupational Employment Statistics, Bureau of Labor Statistics.
For the latest 10 years for which data are available (2006-2016), employment in both occupation groups was strong, with employment of practitioners growing 21 percent and employment in support occupations growing 15 percent. Wage growth over the period was more modest, with practitioners’ wages growing slightly faster than the national rate, and support occupations experiencing slightly slower growth. Wage growth over the period was more modest, with practitioners’ wages growing slightly faster than the national rate, and support occupations experiencing slightly slower growth.
The U.S. Bureau of Labor Statistics lists three health care support occupations among the top five fastest-growing occupations over the next 10 years: home health aides, personal care aides and physician assistants.3 Projected employment growth in these occupations is between 37 and 47 percent. “Nurse practitioners” is the only practitioner group in the top 10, with a projected growth rate of 36 percent.
While the projected growth rate of registered nurses is slower, the base number is so large that this occupation is projected to have the third most new jobs over the next decade (437,000). Again, personal care aides and home health aides are also in the top five, with 754,000 and 425,000 new jobs, respectively.
What begins to appear, based on past trends and BLS projections, is a gradual shift in the health care sector toward more low-pay support positions.
The Sector in the Eighth District
Like in most parts of the nation, health care plays an integral role in the economy of the Eighth District, which is the area covered by the St. Louis Fed. Louisville, Ky., is home to two of the nation’s largest health care firms: Humana Inc. and Kindred Healthcare. St. Louis is home to two of the District’s other national health care firms: Express Scripts Holding Co. and Centene Corp.
Although the District is the headquarters for many large firms, the overall share of employment in the health care sector is only about 0.5 percentage points higher than the national rate. The sector’s output share, however, is 7.9 percent in the District, compared with 6.6 percent nationally. Among the four largest metro areas in the District, St. Louis has the greatest share of output derived from health care, at 8.2 percent.
The District’s growth in the health care sector over the last decade has broadly followed the national trends. The District health care sector steadily added jobs throughout the recession. (See Figure 2.)
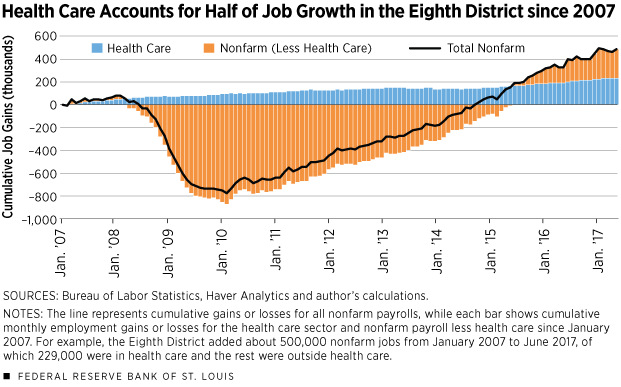
Overall, the District health care sector grew only slightly slower than the national benchmark; however, job growth outside the health care sector has been about half the national rate. As a result, the District economy added about 500,000 jobs almost equally split between the health care sector and other sectors. The health care sector employs about 10 percent of the regional workforce and generated almost 50 percent of the new jobs in the last 10 years.
Employment of health care practitioners grew 17 percent in the District, slightly slower than the national rate of 21 percent. However, employment in support occupations in the District grew only 5.5 percent, notably slower than the national rate of 15 percent. The wage premium for practitioners in the District is broadly consistent with the national average of 60 percent more than what private sector workers in general earn; however, practitioners in Memphis have the highest hourly rate among the District’s major MSAs, and earn 73 percent more than other private sector workers in the Memphis metro area. In St. Louis, practitioners earn a wage premium of 45 percent.4
Outlook
These trends present a unique set of challenges and opportunities. The key reason that health care has dominated regional employment growth over the last decade is not because job growth in the sector has been considerably faster than the nation; rather, it is because growth outside the sector has been much weaker.
Overall demographic trends continue to indicate that the health care sector will continue to show strong growth, and the sector is less sensitive to business cycle fluctuations. These are positives for the region.
However, growth in health care does not guarantee broad-based prosperity. Beyond the high pay of health care practitioners, the health care jobs in highest demand pay lower-than-average wages. More importantly, 40 percent of jobs in the health care sector are not jobs like doctors, nurses or health aides, but jobs in management, technology and other professional occupations. As a result, continued growth in the health care sector will require a pool of workers with diverse skill sets and backgrounds that may come from other industries.
Research assistance was provided by Heting Zhu, a research associate at the Federal Reserve Bank of St. Louis.
Endnotes
- The specific industries are: Ambulatory Health Care Services (NAICS 621); Hospitals (NAICS 622); and Nursing and Residential Care Facilities (NAICS 623). NAICS is the North American Industry Classification System. [back to text]
- Pharmaceutical and Medicine Manufacturing (NAICS 3254); Drug Stores and Pharmacies (NAICS 44611); and Direct Life and Health Insurance Carriers (NAICS 52411). [back to text]
- See www.bls.gov/emp. [back to text]
- Much of the differences in these wage premiums can be attributed to differences in the types of practitioners on a more detailed level. For example, Memphis has a larger share of general internists compared to St. Louis, and these workers earn a very high wage premium of 550 percent in both areas. [back to text]

Views expressed in Regional Economist are not necessarily those of the St. Louis Fed or Federal Reserve System.
For the latest insights from our economists and other St. Louis Fed experts, visit On the Economy and subscribe.
Email Us