

2021: The Year of High Inflation
Inflation was high throughout most of 2021 and has remained high in the first couple of months of 2022, reaching rates not seen since the early 1980s. A combination of factors contributed to the return of high inflation, and the expectation is for inflation to remain high for some time.
To provide historical context, the figure below shows the inflation rate, measured as the annual change in the personal consumption expenditure (PCE) price index, since January 1960. As we can see, year-over-year inflation was 6.4% in February 2022, the most recent date available as of publication. When inflation is measured by the increase in the consumer price index (CPI), we obtain even higher figures: 7.9% year-over-year in February 2022.Note that due to methodological differences, inflation measured with the CPI tends to be higher than when measured with the PCE price index. We have to go back 40 years for inflation rates to be this high.
PCE Annual Inflation
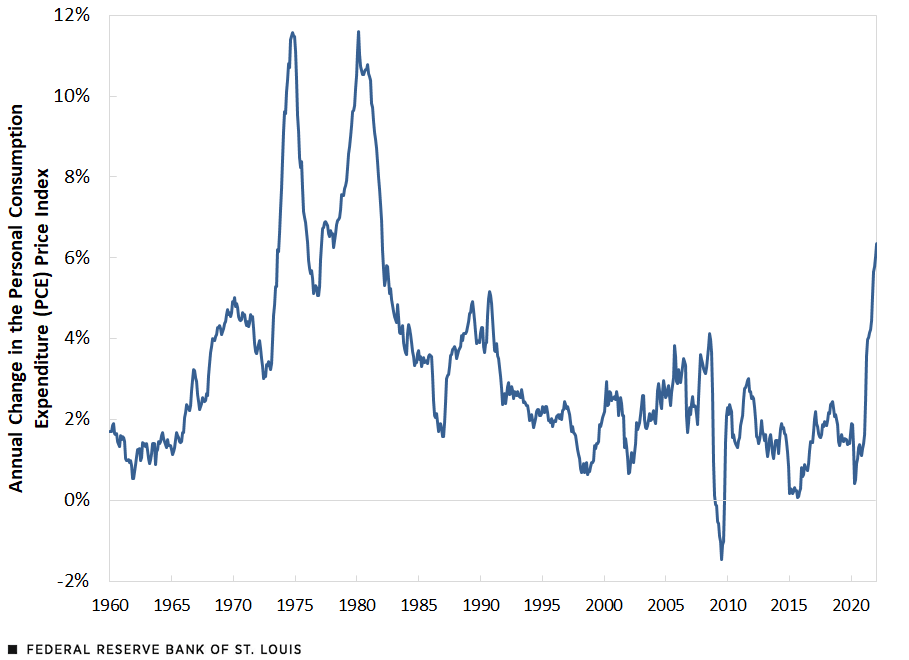
SOURCE: Bureau of Economic Analysis.
Though initially deemed a short-lived phenomenon and largely the product of a relatively narrow group of goods and services, high inflation has proved persistent and generalized.See my previous On the Economy blog posts, “ What Are the Risks for Future Inflation?” and “How Widespread Are Price Increases in the U.S?” As such, it has become a growing concern for policymakers, analysts and the public.
The following table summarizes what has happened to inflation, according to various measures and different periods.
| PCE Price Index | Core PCE Price Index | CPI | |
|---|---|---|---|
| 2016-19 | 1.8% | 1.8% | 2.1% |
| 2020 | 1.3% | 1.5% | 1.3% |
| 2021 | 5.8% | 4.9% | 7.1% |
| COVID-19 | 4.0% | 3.4% | 4.7% |
| NOTES: Core PCE excludes food and energy. The COVID-19 period starts in March 2020 and ends in February 2022. | |||
| SOURCES: Bureau of Economic Analysis, Bureau of Labor Statistics and author’s calculations. | |||
The table provides three different measures of inflation: the change at an annual rate in the PCE price index, the core PCE price index (which excludes food and energy) and the CPI. There are several periods of interest. The first, 2016-19, covers a recent pre-pandemic period of relative price stability with inflation close to the Federal Reserve’s 2% target. The next are the years 2020 and 2021. The last one, COVID-19, covers the pandemic period since March 2020 until February 2022, which is the latest date available.
The clear result from the table is that whether the focus is on the entire pandemic period or just 2021, inflation is significantly higher than before the pandemic, regardless of how we measure it. Inflation was much higher in 2021 than over the entire pandemic period, as it stayed low throughout 2020 and then accelerated during 2021.
How Generalized Was Inflation?
We can look at inflation for the three major categories of personal consumption expenditures: nondurable goods, durable goods and services. The table below shows inflation rates for each of these categories for the various periods considered. We should note that, roughly speaking, nondurable goods represent 22% of total PCE, durable goods account for 12% and services represent 67%.
| Nondurable Goods | Durable Goods | Services | |
|---|---|---|---|
| 2016-19 | 1.0% | -2.0% | 2.6% |
| 2020 | -0.9% | 1.4% | 2.0% |
| 2021 | 7.4% | 10.6% | 4.3% |
| COVID-19 | 4.6% | 6.3% | 3.3% |
| NOTE: The COVID-19 period starts in March 2020 and ends in February 2022. | |||
| SOURCES: Bureau of Economic Analysis, Bureau of Labor Statistics and author’s calculations. | |||
Prices of all three expenditure categories rose at higher rates during the pandemic period. As with average prices, all categories show an acceleration in 2021 that has persisted into early 2022. In fact, all three inflation rates have remained above 2% annually since March 2021.
The figure below shows the price index of each of the major components of PCE since 2012. As we can see, in the years preceding the COVID-19 pandemic, the average price of nondurable goods was roughly constant, the average price of durable goods was declining steadily, and the average price of services was increasing steadily. After the disruptions of 2020, the prices of all major expenditure components began rising faster than in the pre-pandemic period. In the case of goods, prices have been growing rapidly, reversing either a constant or declining trend. As mentioned earlier, the acceleration in the inflation rate for services is not as dramatic, but it has surpassed 3% annually each month since April 2021 and 4% annually since November 2021.
PCE Price Index by Major Components
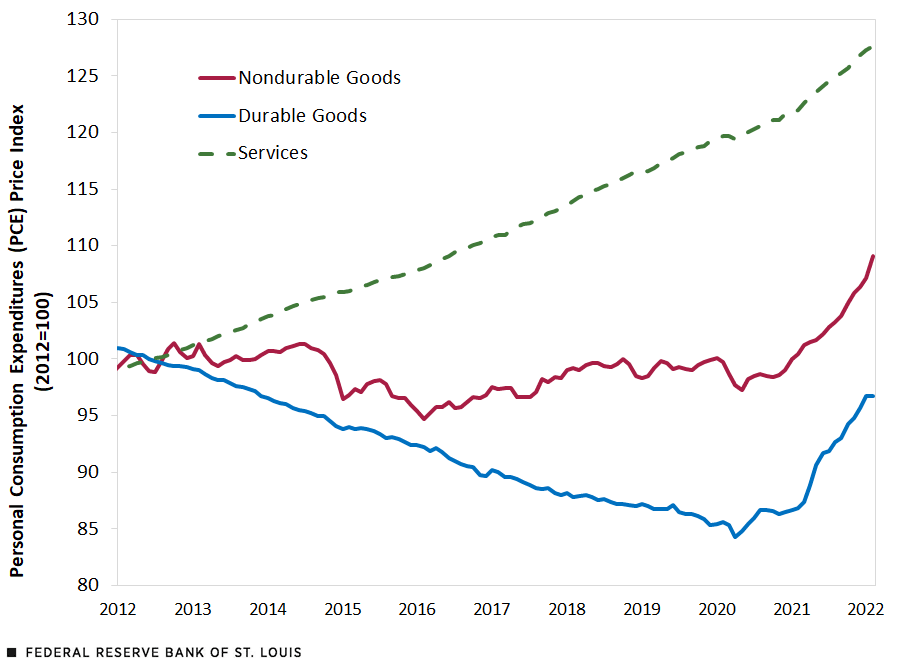
SOURCES: Bureau of Economic Analysis and author’s calculations.
It is also informative to focus on a select group of product categories. For example, food, energy, housing and health care are important expenditures for the typical household. Together, they make up more than 40% of aggregate consumption expenditures .Recall that the former two categories are excluded when computing core PCE. The table below presents the inflation rates of these categories.
| Food | Energy | Housing | Health Care | |
|---|---|---|---|---|
| 2016-19 | 0.2% | 4.0% | 3.4% | 1.7% |
| 2020 | 3.9% | -7.7% | 2.2% | 2.6% |
| 2021 | 5.7% | 29.0% | 3.7% | 2.7% |
| COVID-19 | 5.6% | 13.2% | 3.1% | 2.9% |
| NOTE: The COVID-19 period starts in March 2020 and ends in February 2022. | ||||
| SOURCES: Bureau of Economic Analysis, Bureau of Labor Statistics and author’s calculations. | ||||
The inflation rates of both food and energy have increased significantly. Given the disruptions caused by the Russia-Ukraine war, we can expect both these components to contribute significantly to aggregate inflation in the coming months.
Inflation in housing started accelerating towards the end of 2021. As house prices have increased significantly since the pandemic started, we may expect this component of PCE inflation to increase further over the coming months. For a recent outlook on housing services inflation, see YiLi Chien and Julie Bennett’s March 28 OTE blog post, “Breaking Down the Contributors to High Inflation." Finally, health care inflation has accelerated relative to the pre-pandemic period, though the increase has been moderate so far.
Lastly, we can further decompose inflation by product category. The disaggregated data published by the Bureau of Economic Analysis consists of 244 product categories with monthly series on expenditures, prices and real quantities. There is some double counting in the report, so the actual number of product categories is slightly smaller. See the BEA’s National Income and Product Accounts tables 2.4.4U, 2.4.5U and 2.4.6U. For each product category, I computed the annualized price change and the expenditure share in each period. The figure below estimates the distribution of inflation across product categories, with annualized price changes on the horizontal axis and the corresponding expenditure shares on the vertical axis.For a full description of the methodology, see “How Widespread Are Price Increases in the U.S.?”
Estimated Distribution of Annualized PCE Inflation
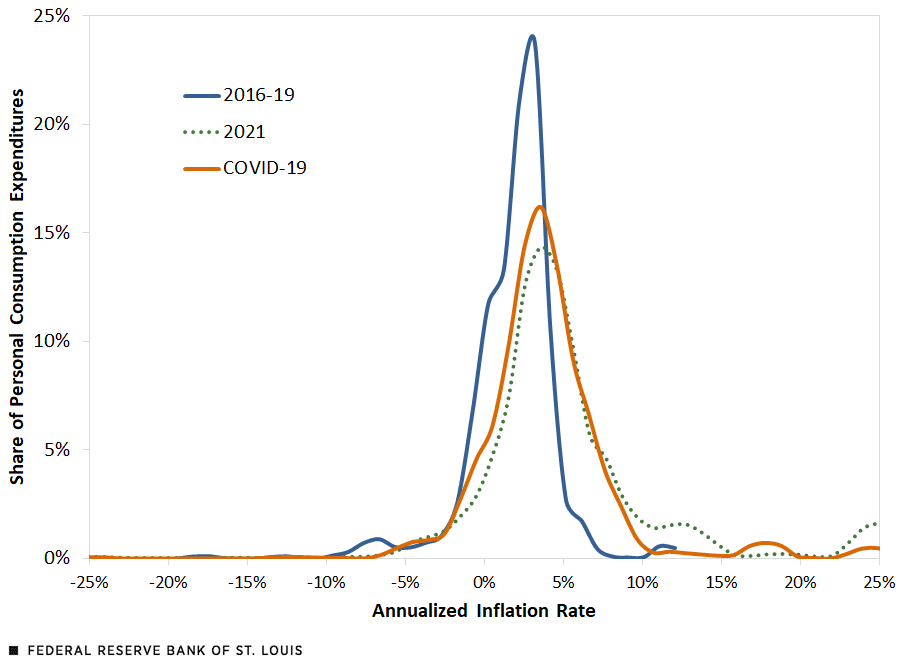
NOTES: Distributions are computed with Kernel Density Estimation in STATA, using the optimal bandwidth for each period. The COVID-19 period starts in March 2020 and ends in February 2022.
SOURCES: Bureau of Economic Analysis and author’s calculations.
Relative to the pre-pandemic period, a larger share of consumption expenditure has experienced higher price increases, and this is even more pronounced for 2021. The shift in the inflation distribution across product categories is significant and supports the notion that high inflation is a generalized phenomenon.
The role of outliers is small: Though there are product categories whose price increased by double digits in annual terms, their expenditure share is too small to explain the increase in overall inflation. For example, if we only included product categories whose inflation during the COVID-19 period was between -20% and +20% at an annual rate, overall PCE inflation would fall from 4.0% to 3.7%. If we further restricted these bounds to -10% to +10%, then inflation would fall to 3.3%. That is, even if we removed those prices that changed the most, inflation would still be elevated, though perhaps not as dramatically.
Supply and Demand Factors
Previously, I described several channels that could explain the rise in inflation. Broadly speaking, high inflation has been a combination of supply and demand factors. Though we may disagree on their relative contribution, we should not dismiss either.
On the supply side, we have the supply chain disruptions that have dominated the news. In part, this is due to how pandemic mitigation policies have interacted with production, commerce and transportation. These factors are largely transitory, though they have proved persistent as the pandemic dragged on.
However, we also need to recognize that a strong shift in consumption habits (e.g., eating at home versus at a restaurant or watching a movie at home rather than at a theater), has put demand pressures on goods at the expense of services. This increased demand has met with production capacity constraints, which explains why certain goods are hard to find, suffer from extended delivery times or register sharp price increases.
The figure below shows real PCE by its major components and clearly demonstrates the shift in consumption patterns during the pandemic. Looking at the value of PCE in real dollars allows us to ignore the effect of price increases on expenditure and thus focus on quantities consumed.
Real consumption expenditures on both nondurable and durable goods increased significantly during the pandemic and are currently above their pre-pandemic trend. This is especially so for durable goods. In contrast, real expenditure in services declined sharply and has only recently recovered to pre-pandemic levels. As COVID-19 mitigation policies wane and economic activity returns to normal, the expectation is that services expenditures will experience robust growth.
Real PCE by Major Components
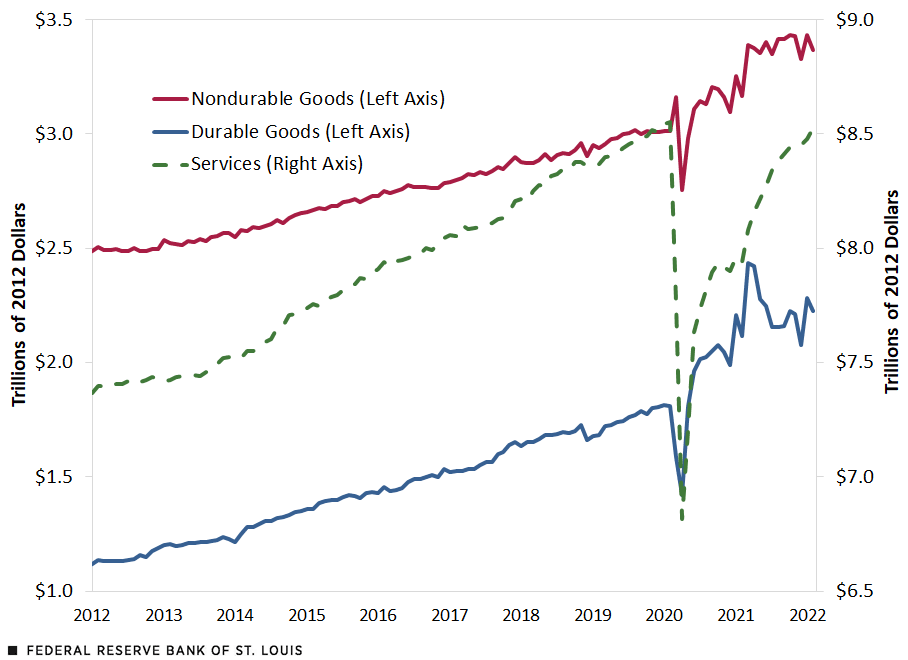
SOURCE: Bureau of Economic Analysis.
Concurrent with these developments, the federal government provided several rounds of economic assistance to individuals and businesses. According to the Congressional Budget Office, the combined deficit in fiscal years 2020 and 2021 was almost $6 trillion, or roughly 14% of GDP across the two years. As a reference, the deficit was almost $1 trillion, or 4.7% of GDP in 2019.See the Congressional Budget Office’s “Monthly Budget Review: Summary for Fiscal Year 2021” for the exact figures.
Pent-up Demand
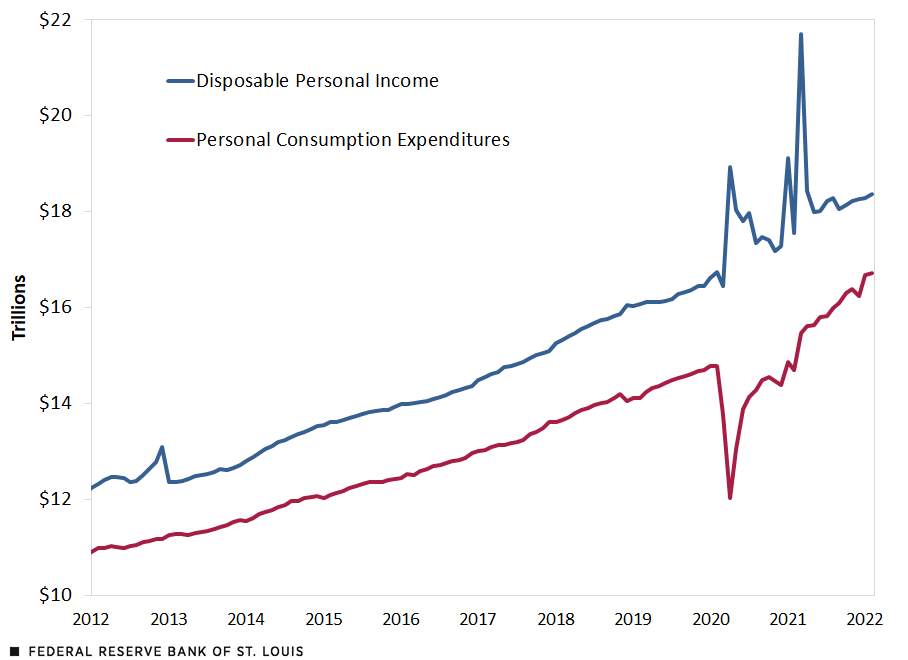
Though the full impact on households’ finances is hard to quantify, federal economic assistance resulted in significant increases in personal disposable income. The figure below compares disposable income with consumption expenditure. We can clearly see the impact of the three major rounds of direct assistance to households in 2020 and 2021, as well as the sharp drop in consumption during the early stages of the pandemic. Note that, as opposed to the previous figure, the data here are nominal and so include the effects of inflation.
Disposable Income and Consumption
SOURCE: Bureau of Economic Analysis.
The figure above tells a story about aggregate behavior. Currently, consumption is slightly above trend. However, on the aggregate, most of the assistance received from the federal government has not yet been spent. In other words, households have significant savings at their disposal. Households appear to have used a significant fraction of the initial round of assistance to reduce debts. For example, see “How Have Households Used Their Stimulus Payments and How Would They Spend the Next?” from the New York Fed. As time went on, however, household debt started growing at a faster pace than it did pre-pandemic. As the economy returns to normal, one could expect savings to decline, which would imply an increase in consumption as those savings are spent. A counterargument to this is that households are keeping savings high to pay future tax increases.
If the first argument proves even partially correct, then we have not yet seen the full effects of pent-up demand and should expect further demand pressures on inflation. This might especially materialize in services, which are still lagging in terms of expenditures, as shown in the fourth figure.
It is important to point out that the fifth figure and arguments above describe aggregate behavior. At the individual household level, we should not expect similar patterns across income or wealth groups. When receiving temporary supplements to their income, poorer households tend to consume most or all of it, while richer households tend to save it. However, note that most high-income households did not receive direct federal assistance during the pandemic.
Another way in which federal assistance has manifested itself is in the expansion of monetary aggregates. For example, M2 grew 5.6% annually between 2016 and 2019. It then jumped by 15.4% between March and May 2020, and it has been growing 12.1% annually since then.Roughly speaking, M2 includes currency in circulation outside banks, demand deposits, small time deposits and most balances in retail money market funds. The growth in M2 tracks accumulated federal deficits well, which is not surprising given that the increase in this monetary aggregate was in large part due to the assistance provided to households during the pandemic. Since the pandemic started, the rise in M2 has exceeded the increase in prices by a factor of five. This may be due to a variety of reasons, but it does raise a concern about inflationary pressures that may not have fully materialized yet.
End Game: Beyond High Inflation
In its March 2022 meeting, the Federal Open Market Committee (FOMC) raised the target federal funds rate for the first time in two years. Markets expect that the Federal Reserve will continue raising rates to drive down inflation. How aggressively the Fed will pursue this goal is still an open question. This is due in part to the adoption of a new monetary policy framework in August 2020, which seeks to achieve inflation that averages 2% over time.
An important concern is where inflation will be headed over the medium and long run. Different theories suggest different mechanisms for long-run inflation and hence possibly arrive at different answers.
Subscribers to New Keynesian theory, popular among central bankers, view long-run inflation as the product of inflation expectations. These expectations are “anchored” by monetary policy, typically around the central bank’s own inflation target. This is why central banks are concerned about long-run inflation expectations: They act as barometers of their credibility.
In contrast, monetarists and subscribers to the fiscal theory of price level attribute long-run inflation to the growth rate of government nominal liabilities (money and debt). Critically, long-run inflation depends on who controls this growth rate. If the central bank accommodates fiscal policy, then it is the fiscal authority that determines the growth rate of government liabilities and, thus, long-run inflation. This situation is known as “fiscal dominance.” Alternatively, the fiscal authority may curb its expansionist impulses if it believes the central bank will do whatever it takes to keep inflation within its target.Specifically, the central bank threatens to create a recession, via higher interest rates, until the fiscal authority relents.
Setting the fiscal dominance scenario aside, New Keynesian, monetarist and fiscal theory of the price level theories agree that the Fed’s credibility is critical for the control of long-run inflation. Depending on one’s view, this involves managing long-run inflation expectations or avoiding situations in which the fiscal authority challenges the central bank’s willingness to defend the inflation target. High inflation currently poses a risk to this credibility. It would be very costly if the Fed were to lose the credibility of its inflation target and had to conduct policy to regain it.
Notes and References
1 Note that due to methodological differences, inflation measured with the CPI tends to be higher than when measured with the PCE price index.
2 See my previous On the Economy blog posts, “ What Are the Risks for Future Inflation?” and “How Widespread Are Price Increases in the U.S?”
3 Recall that the former two categories are excluded when computing core PCE.
4 For a recent outlook on housing services inflation, see YiLi Chien and Julie Bennett’s March 28 OTE blog post, “Breaking Down the Contributors to High Inflation."
5 There is some double counting in the report, so the actual number of product categories is slightly smaller. See the BEA’s National Income and Product Accounts tables 2.4.4U, 2.4.5U and 2.4.6U.
6 For a full description of the methodology, see “How Widespread Are Price Increases in the U.S.?”
7 See the Congressional Budget Office’s “Monthly Budget Review: Summary for Fiscal Year 2021” for the exact figures.
8 Households appear to have used a significant fraction of the initial round of assistance to reduce debts. For example, see “How Have Households Used Their Stimulus Payments and How Would They Spend the Next?” from the New York Fed. As time went on, however, household debt started growing at a faster pace than it did pre-pandemic.
9 Roughly speaking, M2 includes currency in circulation outside banks, demand deposits, small time deposits and most balances in retail money market funds.
10 Specifically, the central bank threatens to create a recession, via higher interest rates, until the fiscal authority relents.

This blog offers commentary, analysis and data from our economists and experts. Views expressed are not necessarily those of the St. Louis Fed or Federal Reserve System.
Email Us
All other blog-related questions
