

What Are the Risks for Future Inflation?
For several months now, inflation has been running high, well above the Federal Reserve’s 2% annual target. For example, between August 2020 and August 2021, the personal consumption expenditures (PCE) price index grew by 4.3%.
In its most recent statement, the Federal Open Market Committee (FOMC) recognized that “inflation is elevated” but attributed it to “largely … transitory factors.” In his August speech at Jackson Hole, Federal Reserve Chair Jerome Powell stated that “the spike in inflation is so far largely the product of a relatively narrow group of goods and services” and that “households, businesses, and market participants also believe that current high inflation readings are likely to prove transitory.”
In August 2020, the Federal Reserve adopted a new framework that seeks to achieve inflation that averages 2% over time. Since inflation had been running below 2% annually in the recent past, higher temporary inflation is consistent with the Federal Reserve’s objective. The risk, however, is that inflation may become even higher or that high inflation persists for longer.
In this blog post, which is the first of a two-part series, I will review some facts about the recent surge in inflation and identify some upside and downside risks for future inflation. In the second blog post, I will focus on evaluating whether higher inflation can be attributed to a small group of goods and services or whether it is a more generalized event.
Inflation by the Numbers
The figure below shows the PCE price index since 2012, when the Federal Reserve adopted an explicit 2% annual inflation target. After a significant decline in energy prices put downward pressure on the overall price level in 2014-15, the PCE price index grew steadily, at an average 1.8% annually, until the COVID-19 pandemic struck in March 2020. Prices then took a deep dive and only came back to trend in early 2021. Since then, the price level has been significantly above its pre-pandemic trend.
Projecting the pre-pandemic trend forward, prices in August 2021 were at the level we would have expected them to be in October 2022. If, instead, we project a hypothetical 2% annual trend starting in 2016, then the price level caught up with that trend between May and June 2021 and is now above it.
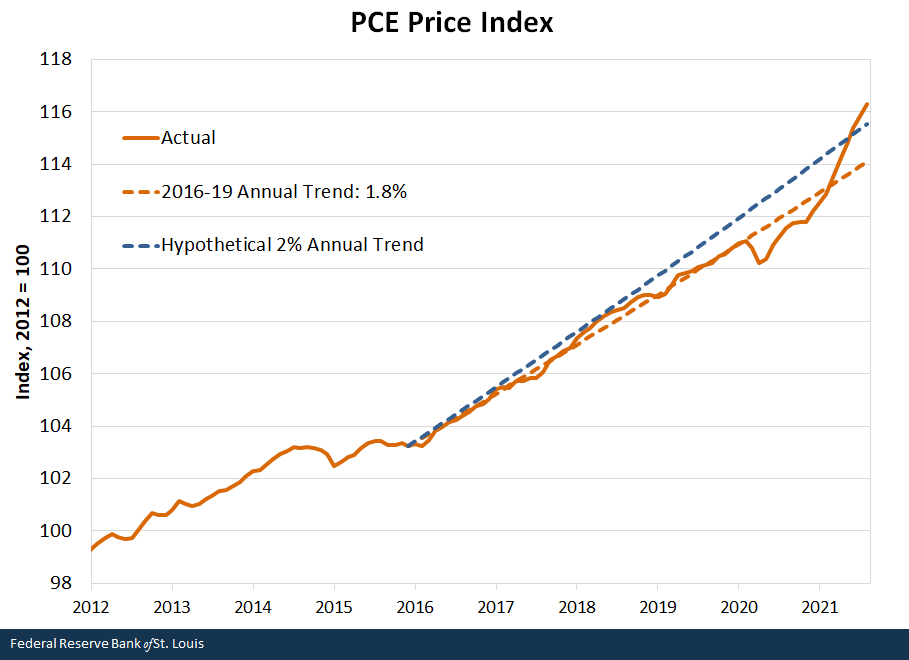
SOURCES: Bureau of Economic Analysis and author’s calculations.
The following table summarizes what has been happening to inflation, according to various measures.
| Personal Consumption Expenditures (PCE) |
Core PCE | Consumer Price Index | Producer Price Index | |
|---|---|---|---|---|
| 2016-19 | 1.8% | 1.8% | 2.1% | 2.0% |
| 2020 | 1.3% | 1.5% | 1.3% | 0.8% |
| 2021 | 5.5% | 4.8% | 6.6% | 10.7% |
| COVID-19 | 3.1% | 2.9% | 3.6% | 5.3% |
| NOTES: The COVID-19 period starts in March 2020; the last data points are for August 2021. Core PCE excludes food and energy. | ||||
| SOURCES: Bureau of Economic Analysis, Bureau of Labor Statistics and author’s calculations. | ||||
Looking at various price indexes—PCE, core PCE (which excludes food and energy), consumer price index (CPI) or producer price index (PPI)—tells the same story: Inflation dropped significantly in 2020 and has been running significantly higher in 2021. When we consider the entire COVID-19 period (i.e., from March 2020 until August 2021) inflation is still elevated, at 3.1% annual.
Theory as a Guide
In a recent post, I discussed the various views on what determines inflation. First, we can think of inflation as a self-fulfilling prophecy in which actual inflation depends on expected inflation. This view, adopted by many central banks around the world, explains why they are preoccupied with anchoring inflation expectations around their inflation target. Second, the Phillips curve theory posits a negative relationship between inflation and unemployment; it is mostly used to explain cyclical variations in inflation around some long-run value. Third, monetarism is the theory that relates the price level to some monetary aggregate (e.g., currency) and inflation to the growth rate of that monetary aggregate. In a modern economy, currency accounts for a small fraction of transactions, so economists look at “broader” monetary aggregates (such as M1 or M2 M1 includes physical currency, demand deposits, traveler’s checks and other checkable deposits. M2 includes M1 plus “near money” such as savings accounts and money market funds.). Finally, a collection of related theories links prices or inflation to the level of government debt and expected future fiscal surpluses; though their mechanisms vary, they all predict higher prices or inflation as debt rises.
When going from theory to reality, there are two important considerations. First, we need to distinguish a one-time price increase from a sustained increase in prices. Both would be recorded as inflation even though they are conceptually distinct phenomena. Taking the monetarist approach as an example, if the government were to issue new money and transfer it to households just once (what is known as a “helicopter drop”), the theory predicts that we would observe a corresponding increase in the price level. After that initial price increase (which may not be instantaneous and may instead materialize over some time), we would not expect the inflation rate to change relative to the pre-injection period. In contrast, if we were to increase the rate at which money is printed and transferred to households, then the monetarist theory would predict a permanent increase in the inflation rate.
Second, inflation theories are constructed to explain a broad, generalized increase in prices. In reality, changes in relative prices (e.g., an increase in oil prices) affect the average price level and thus impact measured inflation. This can be illustrated in the first figure above, where the price level flattens in 2014-15, mostly due to the significant and sustained fall in energy prices. (The core PCE price index, which excludes food and energy, does not exhibit a similar slowdown.)
Upside Inflation Risks
What can we say about the upside risks for future inflation? The first concern is related to inflation expectations. Long-term inflation expectations, which reflect expectations about the Federal Reserve’s ability to keep inflation under control in the long run, remain well anchored. For example, the five-year, five-year forward expected inflation rate averaged 2.2% annually in August 2021.This is a measure of expected inflation (on average) over the five-year period that begins five years from today. It relies on the difference in yields between nominal and inflation-adjusted Treasury securities. Similarly, the 10-year expected inflation rate constructed by the Federal Reserve Bank of Cleveland has remained below 2% annually throughout the pandemic. In contrast, surveys designed to capture households’ short-term inflation expectations have been trending up. The chart below shows data from the Federal Reserve Bank of New York’s Survey of Consumer Expectations for one-year ahead inflation. It suggests that consumers broadly are expecting higher inflation in the short term.
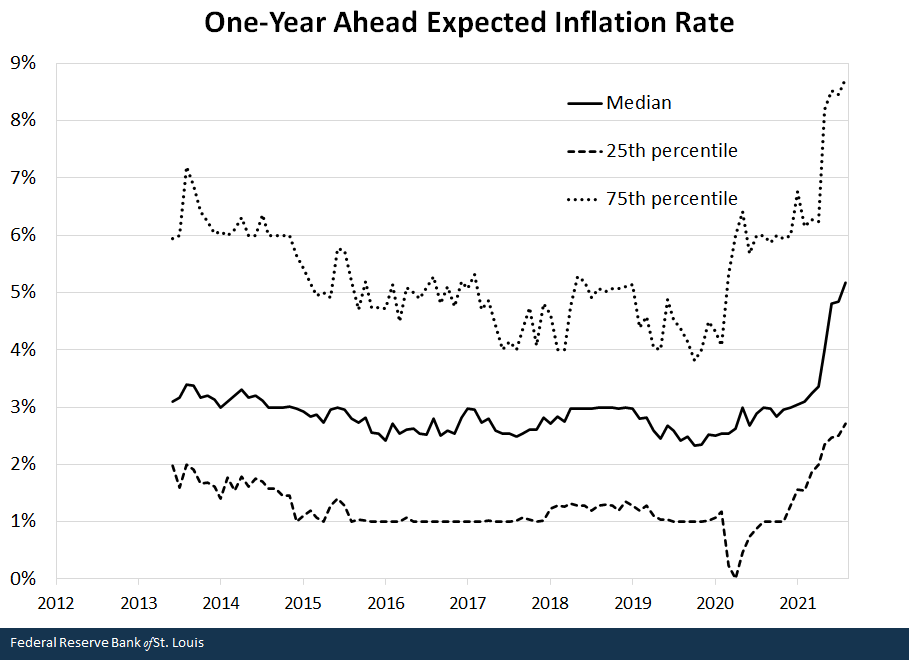
SOURCE: Federal Reserve Bank of New York’s Survey of Consumer Expectations.
A second concern is that a robust demand for labor, coupled with a fast-declining unemployment rate, may put upward pressure on prices. So far, however, wage growth has remained stable. For example, see the wage growth tracker from the Federal Reserve Bank of Atlanta.
A third concern, much discussed in the press and alluded to in Federal Reserve statements, is the increase in costs due to disruptions in supply chains. Images abound of container ships backed up off U.S. ports. Container shipping rates have skyrocketed.For an example of data on rising shipping costs, see Drewry’s composite World Container Index. These cost increases are, at least in part, passed on to the price of final goods and services. Note that this phenomenon corresponds more to a one-time increase in prices than higher permanent inflation. However, the full process may unravel over an extended period and imply higher inflation for some time.
Also note that part of the increasing costs may be due to demand factors and not supply chain disruptions. That is, prices may in part increase because there is more demand for some goods (e.g., electronics) and it takes time for supply to catch up. Where is the extra demand coming from? The answer is in part related to the new pandemic reality (e.g., the rise of working from home) and in part due to the next factor discussed below.
The last source of concern for inflation is due to fiscal and monetary policies. The economic response to the pandemic consisted of an expansionary fiscal policy (large transfers to households and businesses, financed with deficits) and an accommodative monetary policy (including a near-zero policy rate and asset purchases). Subscribers to the monetarist or fiscal views of the origins of inflation would be concerned about the inflationary consequences of such policies.
The figure below tracks M2 (a measure of the quantity of “money”) on the left axis and accumulated deficits by the federal government starting in October 2015 (which was the beginning of fiscal year 2016) on the right axis.In the U.S., the fiscal year runs from Oct. 1 to Sept. 30. Fiscal years are referenced by their end date.
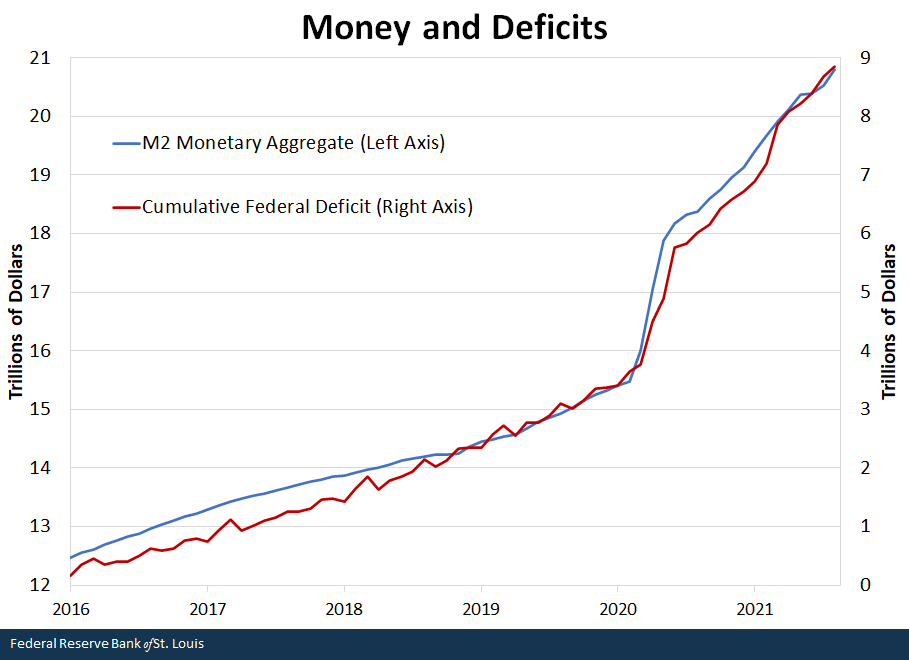
NOTES: Data are monthly. The cumulative deficit starts in October 2015, but the figure shows data beginning in January 2016.
SOURCES: Federal Reserve, U.S. Treasury and author’s calculations
Both series track each other well, suggesting that the expansion of money in the economy has a fiscal origin. Between 2016 and 2019, M2 grew at a rate of 5.6% annually. Between February and May 2020 it grew by 15.6%, reflecting the large transfers made to households and businesses during the initial phases of the pandemic (which included lockdowns).
This increase in the quantity of money would pressure prices to rise (a “one-time” increase, as described earlier) but not affect long-run inflation rates. After this sudden increase, M2 resumed growing at a steady pace but much faster than before the pandemic: 12.5% annually. If this pace persists, it would pressure the inflation rate upward. For this to be the case, future deficits need to be persistently large. As of the writing of this blog post, the Congressional Budget Office is projecting a deficit as a percentage of GDP of 4.7% in fiscal year 2022 and of 4.2% on average for the next 10 fiscal years. These figures are well below those of 2020 and 2021 but high relative to historical standards.
Downside Inflation Risks
One should not dismiss the fact that annual inflation was persistently below the Federal Reserve’s 2% target prior to the COVID-19 pandemic. As mentioned above, long-term inflation expectations indicate that market participants expect inflation to eventually revert to its pre-pandemic level. And it is certainly possible that this may happen sooner rather than later. Two factors may push inflation downward.
First, the pandemic is not yet over. A severe deterioration in the health outlook (e.g., a new dominant variant that is more deadly or transmissible) may motivate authorities to reinstate some of the more restrictive mitigation policies, which could dampen consumption and put downward pressure on prices.
Second, as in the recent past, ample foreign demand for dollar-denominated assets, Treasury securities in particular, may be enough to counteract the effects of expansionary fiscal policy. This is especially the case, as it is now, when the U.S. economy is performing relatively better than the rest of the world.
Conclusions
Inflation has surged as the U.S. economy recovers from the shock of the COVID-19 pandemic. Though long-term inflation expectations remain relatively stable, short-term expectations have caught up with actual inflation, suggesting that elevated inflation may not be over. Supply chain disruptions and increased demand for certain products contributed to the increase in prices, although they will likely not have an impact on long-term inflation. Finally, the fiscal and monetary responses and the fiscal outlook suggest further risk of elevated inflation for some time. Some factors, like foreign demand for U.S. assets, may counteract these risks.
Overall, even though higher inflation may be transitory, the transition may last longer than expected. The risk is that the response of households, market participants and policymakers to a prolonged period of high inflation may itself sow the seeds of more persistent higher inflation. Persistent high inflation would also put the Federal Reserve’s new monetary policy framework to the test.
In my next blog post, I will evaluate the claim that the surge in inflation is mostly the product of a small group of goods and services.
Notes and References
1 M1 includes physical currency, demand deposits, traveler’s checks and other checkable deposits. M2 includes M1 plus “near money” such as savings accounts and money market funds.
2 This is a measure of expected inflation (on average) over the five-year period that begins five years from today. It relies on the difference in yields between nominal and inflation-adjusted Treasury securities.
3 For example, see the wage growth tracker from the Federal Reserve Bank of Atlanta.
4For an example of data on rising shipping costs, see Drewry’s composite World Container Index.
5In the U.S., the fiscal year runs from Oct. 1 to Sept. 30. Fiscal years are referenced by their end date.

This blog offers commentary, analysis and data from our economists and experts. Views expressed are not necessarily those of the St. Louis Fed or Federal Reserve System.
Email Us
All other blog-related questions
