

COVID-19 and Financial Distress: Employment Vulnerability
The following is the first post in a series examining the potential impact of COVID-19 on workers in areas already experiencing higher levels of financial distress.
COVID-19—and the public’s engagement in social distancing—will inevitably affect different industries in different ways:
- Some jobs require little face-to-face interaction with clients and can often be completed from home. Examples include farming and computer programming.
- Other jobs—particularly those that specialize in “social” services like accommodation and food services (think of restaurants)—will face significant challenges in these conditions.
And while sectors will be hit unevenly, so too will people. A general feature of our economy is that relatively secure and highly paid jobs are most often the easiest jobs to make remote, while more insecure, relatively low-paying jobs are overwhelmingly less amenable to remote delivery. This implies that the burden of this pandemic will not only be borne unevenly across occupations, but that the largest financial burdens may fall on populations that are already the most vulnerable to economic shocks.
Financial Distress
In a recent working paper (PDF), we showed that communities where a higher percentage of people are financially distressed cut their consumption much more in reaction to a given decline in wealth than communities where a lower percentage of people are distressed.
Moreover, the reductions in consumption in some geographies will likely themselves create further distress at the level of a community, as research following the Great Recession suggests.For example, see Athreya, Kartik; Mather, Ryan; Mustre-del-Rio, Jose; and Sanchez, Juan M. “Consumption in the Great Recession: The Financial Distress Channel.” Federal Reserve Bank of St. Louis Working Paper 2019-025A, September 2019. On the scale of an entire economy, then, we would expect that losses to wealth which fall heaviest on more vulnerable people would have a greater overall effect than losses which fall on people who are more financially stable.
Financial Distress and the Accommodation and Food Sector
To predict how COVID-19 may affect household consumption and balance sheets, this post focuses on the “Accommodation and Food” sector, which is particularly vulnerable to a shock that keeps people from gathering as we noted above. We will examine whether this sector tends to employ people from ZIP codes with high financial distress.
By “financial distress,” we mean the percentage of people who go delinquent 30 days or more on a credit card payment over the course of a year.The data used to construct this measure were used in our aforementioned working paper and originally came from the New York Federal Reserve/Equifax CCP dataset for the year 2018. It is available for public download here. Difficulties in making timely payments are likely a good indicator of overall lack of financial capacity and, hence, of vulnerability to temporary shocks, especially severe ones like the one we are experiencing.
To do this, we divided all U.S. ZIP codes into five evenly sized groups—or “quintiles” —defined by their incidence of financial distress. In what follows, we denote the ZIP codes with the lowest financial distress as group “one” and the ZIP codes with the highest financial distress as group “five.”
To obtain data on employment by industry and ZIP code, we used the Census LEHD Origin-Destination Employment Statistics (LODES) data set.Importantly, we used data from the LODES database summed to the ZIP code level in the area where the workers live, as opposed to the area where they work. Thus, even though a worker from a highly financially distressed ZIP code may work in a ZIP code with low financial distress, we will count that job as being filled by a person in the highly financially distressed community. Data are available at the two-digit level in the NAICS framework.
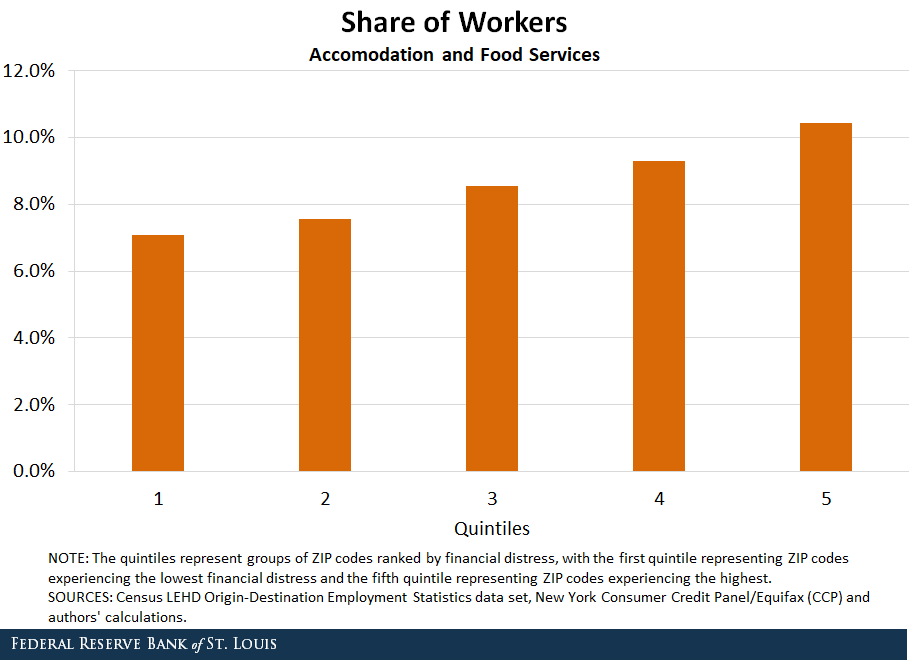
The figure above makes clear that people living in communities within the highest group of financial distress are more likely to be employed in the “Accommodation and Food” sector than are people from the lowest group. Comparing the bottom quintile with the top, we see that 10.4% of the most financially distressed group are working in this sector. Among the least financially distressed, the number is notably lower at roughly 7.1%.
The relationship is also very systematic: Geographic regions in a particular quintile of financial distress consistently tend to have a higher share of their employment in the Accommodation and Food sector than lesser quintiles and a lower share than quintiles with more financial distress.
Financial Distress and Other Employment Sectors
If there is better news, it is that Accommodation and Food—while critical and large in size—seems to be unique in this regard. We show next that, for a variety of other sectors, there seems to be only a slight positive relationship between the ZIP code incidence of financial distress and the share of workers employed in potentially vulnerable industries.
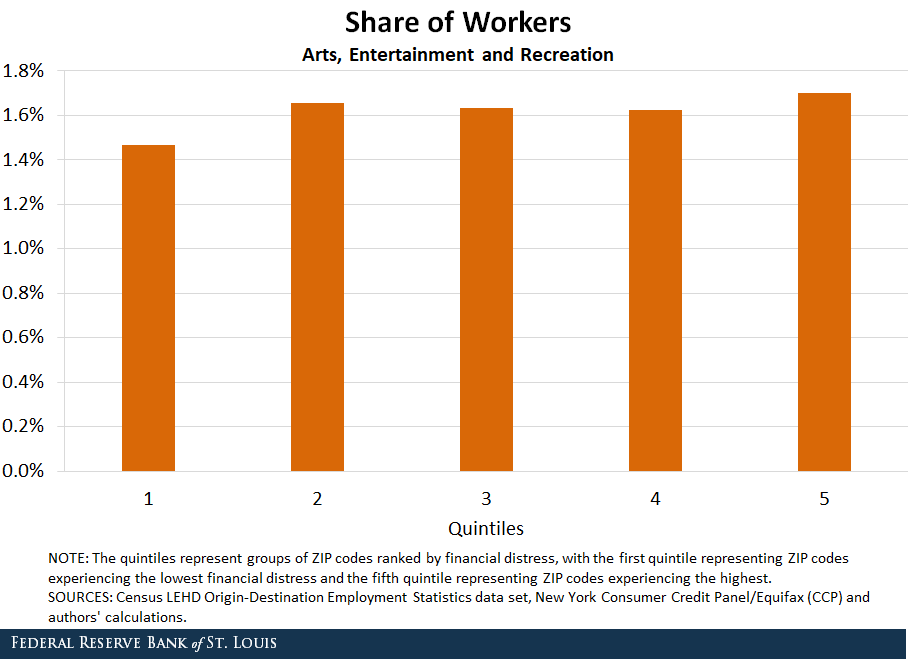
Beginning with “Arts, Entertainment and Recreation,” we see that more financially distressed workers are not more likely to be a part of this sector:
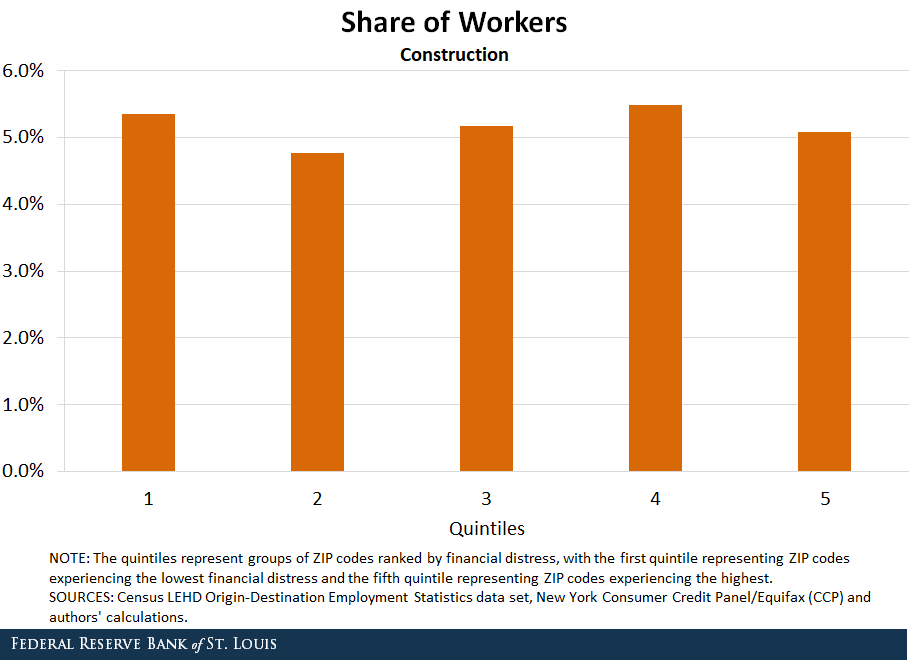
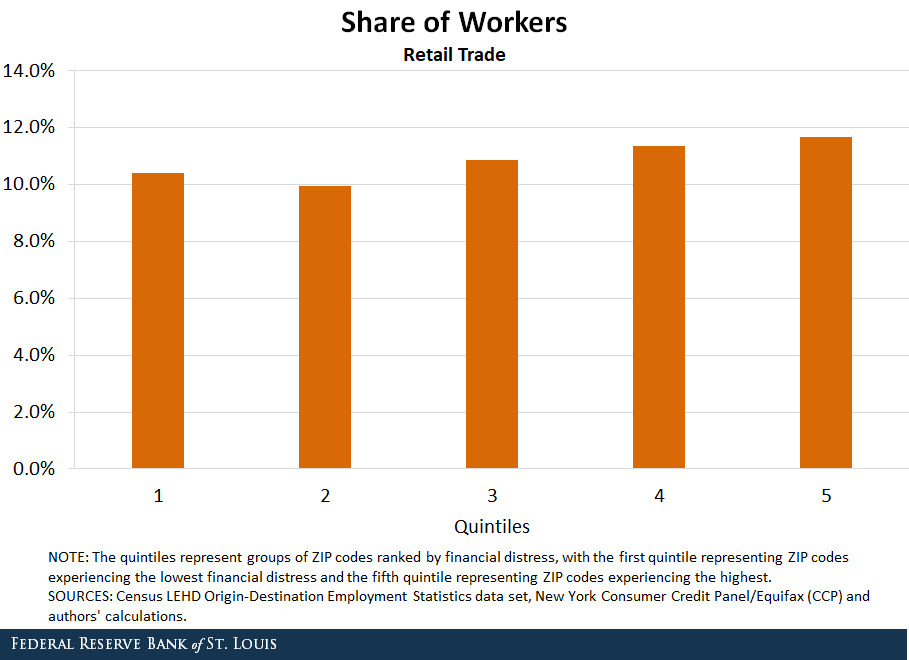
Similarly, we see in the following figures that this holds also for the “Construction,” “Retail Trade” and “Other Services” sectors:
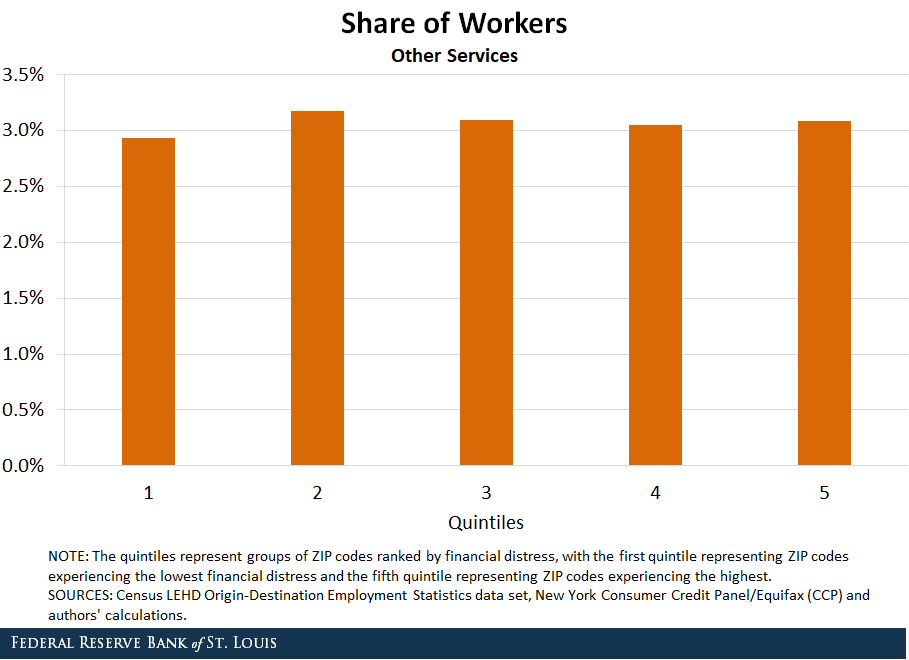
One way to see that the Food and Accommodation sector is especially susceptible is that 32% of workers in the highest quintile of financial distress work in the sectors examined here, while a similar proportion (roughly 27%) of workers in the lowest quintile work in these sectors. Thus, the share of employment in vulnerable sectors taken as whole is not very different across ZIP codes with different distress levels. However, our analysis makes clear that the picture of overall “calm” hides the much clearer pattern within the “Accommodation and Food” sector that covers workers whose services are clearly important for our lives and livelihoods.
In a future post of this series, we will put the data from this post into a model we have developed to project what the possible response of household consumption and balance sheets could be.
Notes and References
1 For example, see Athreya, Kartik; Mather, Ryan; Mustre-del-Rio, Jose; and Sanchez, Juan M. “Consumption in the Great Recession: The Financial Distress Channel.” Federal Reserve Bank of St. Louis Working Paper 2019-025A, September 2019.
2 The data used to construct this measure were used in our aforementioned working paper and originally came from the New York Federal Reserve/Equifax CCP dataset for the year 2018. It is available for public download here.
3 Importantly, we used data from the LODES database summed to the ZIP code level in the area where the workers live, as opposed to the area where they work. Thus, even though a worker from a highly financially distressed ZIP code may work in a ZIP code with low financial distress, we will count that job as being filled by a person in the highly financially distressed community. Data are available at the two-digit level in the NAICS framework.
Additional Resources
- St. Louis Fed’s COVID-19 resource page
- Timely Topics: Financial Distress and COVID-19
- On the Economy: Financial Distress Differences Seen at the ZIP Code Level
This blog offers commentary, analysis and data from our economists and experts. Views expressed are not necessarily those of the St. Louis Fed or Federal Reserve System.
Email Us
All other blog-related questions
