

Reading the Labor Market in Real Time
The coronavirus pandemic has shaken labor markets, leading to unprecedented job losses in March and April. For May, most forecasts predicted a further worsening of employment, with an additional drop of around 7.5 million jobs. However, the jobs report by the Bureau of Labor Statistics released on June 5 showed a big upside surprise, with the number of people employed increasing by around 4 million.In this post, we use the measure of employment from the Current Population Survey and not the Current Employment Statistics survey: The CPS includes the agriculture sector, private households and self-employed individuals, but the CES does not. Also, multiple jobholders are counted only once in the CPS, while each job is counted separately in the CES.
Employment Data in Real Time
The study of U.S. labor markets typically relies on two monthly surveys, the first by the Census Bureau and the second by the Bureau of Labor Statistics:
- The Current Population Survey (CPS), which surveys around 60,000 U.S. households
- The Current Employment Statistics survey (CES), which surveys around 145,000 U.S. businesses and government agencies
However, these rapidly changing conditions call for higher-frequency data to check the temperature of the labor market in real time. For this post, we constructed a coincident index for the state of U.S. labor markets using daily employment data from Homebase.
Homebase is a free scheduling and time-tracking tool used by local businesses and their hourly employees. Homebase’s customers in the U.S. primarily consist of individually owned/operated businesses in the food and beverage, retail, and service industries. The data from Homebase covers 60,000 businesses and around 1 million hourly employees in the U.S. (as of January 2020). The daily data from Homebase reflects changes in employment relative to January. In other words, changes in employment are indexed with January as the baseline. We applied an equivalent indexing technique to the CPS data with January as the baseline.
We compared the changes in employment from January in both the CPS and Homebase in the figures and the table below. For example, the April reading for New York showed –20% in the table later in this post, meaning that employment was 20% below the level of employment in January. (In both figures, we also show a simple regression line, obtained by weighting observations with the employment level in January.)
Employment Changes across Industries
The figure below shows employment changes across industries in the CPS (horizontal axis) and Homebase (vertical axis). Each color represents a different industry. The circles in the scatterplot represent the changes for the week ending on March 13, while the squares represent changes for the week ending on April 17. We focus on these weeks since these are the weeks in which the CPS survey were conducted.Across our analysis, we aggregated daily Homebase data to weekly to smooth any intraweek variation in employment. Moreover, the data are not seasonally adjusted.
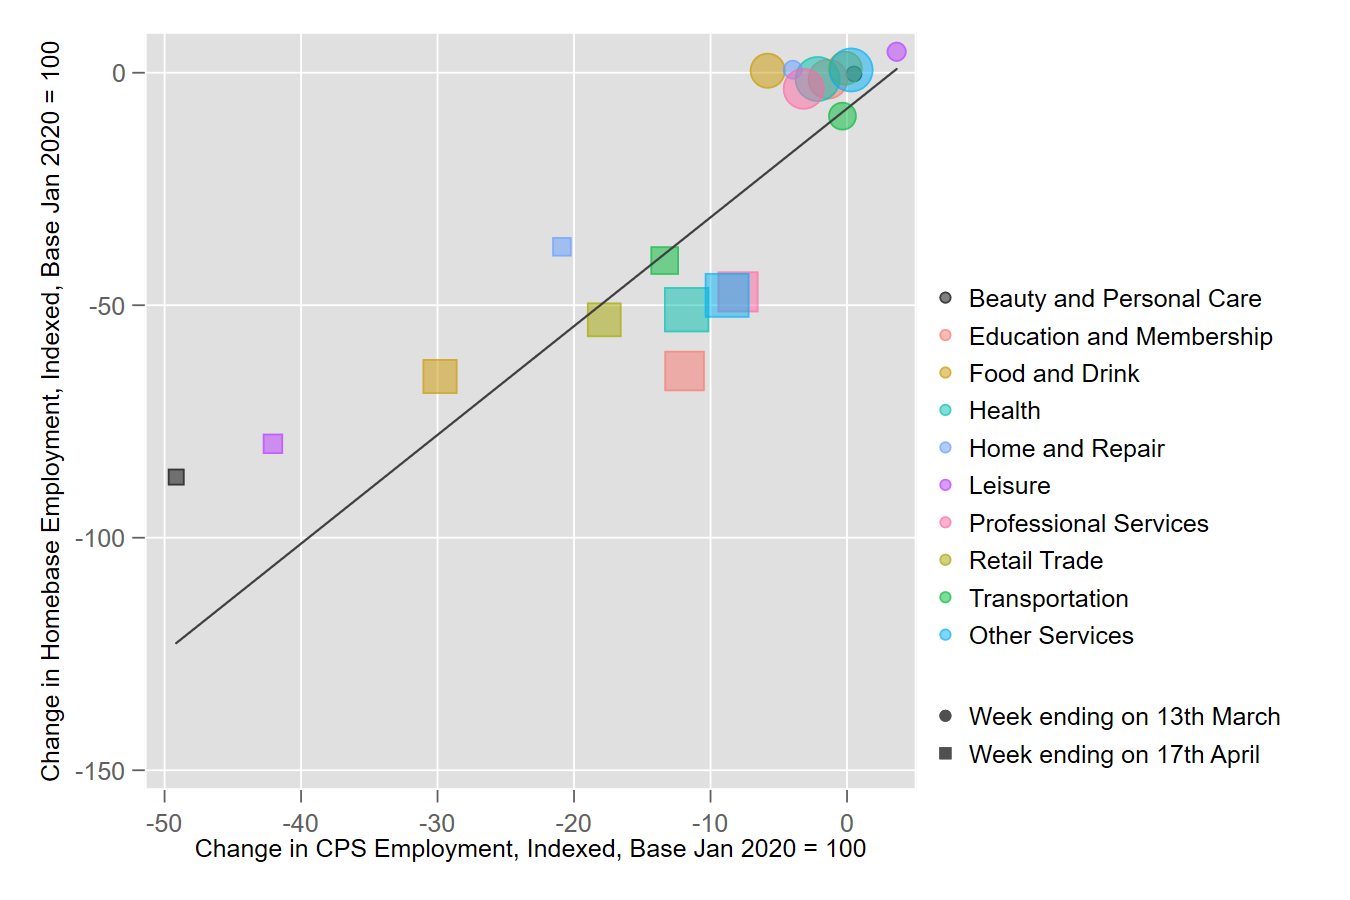
SOURCES: Bureau of Labor Statistics, Homebase and authors' calculations.
The Homebase and CPS data have a strong correlation of 0.82, but the magnitude of the employment change is larger, on average, in the Homebase data.
Employment Changes across States
Similarly, the next figure represents changes in employment for different U.S. states based on the two data sets. Here, data for March are shown in blue, while data for April are in green.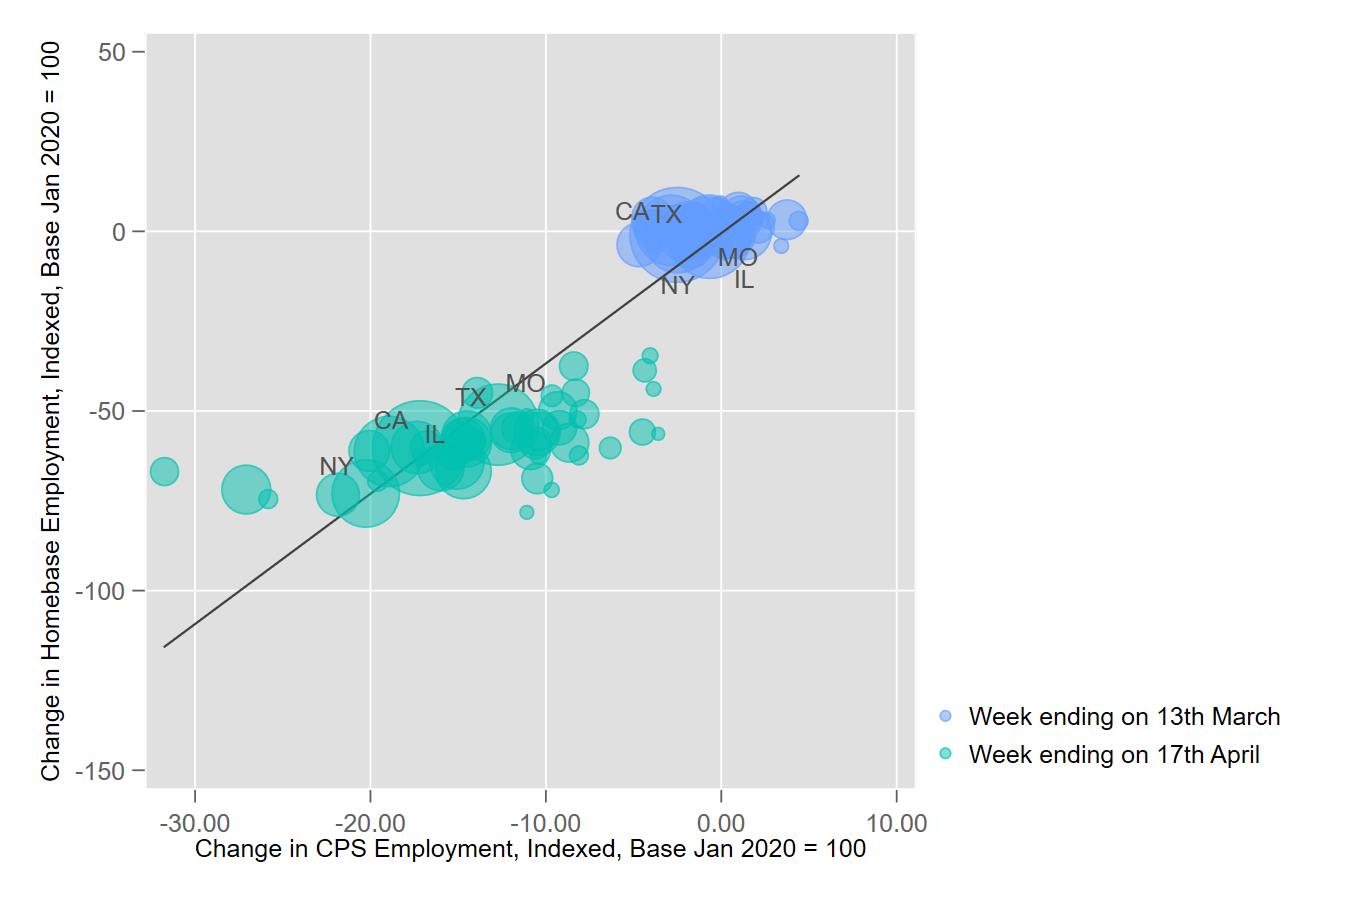
SOURCES: Bureau of Labor Statistics, Homebase and authors' calculations.
The correlation between employment changes in the two data sets using state-level data is 0.93, but the magnitude of the change is larger in the Homebase data as well.
Coincident Employment Index and Predicting Employment Changes
Our coincident employment index uses the regression obtained with state-level data in the second figure to predict employment change as measured by the CPS, using information on the employment changes reported by Homebase. Because the Homebase data are reported daily, we can get a real-time indicator of U.S. employment. The results of this exercise are presented in the table below.
| State | CPS Change in Employment: Week Ending April 17 | Predicted CPS Change in Employment: Week Ending May 15 | Predicted CPS Change in Employment: Week Ending June 5 |
|---|---|---|---|
| Four Largest U.S. States by Population | |||
| California | -17.17% | -12.55% | -10.77% |
| Florida | -18.92% | -10.98% | -8.60% |
| New York | -20.27% | -15.59% | -14.02% |
| Texas | -12.72% | -9.00% | -6.99% |
| Eighth District | |||
| Arkansas | -4.50% | -9.79% | -6.99% |
| Illinois | -15.07% | -13.35% | -11.78% |
| Indiana | -20.06% | -9.51% | -6.03% |
| Kentucky | -16.80% | -11.34% | -7.38% |
| Mississippi | -14.14% | -7.42% | -5.09% |
| Missouri | -9.32% | -8.22% | -5.51% |
| Tennessee | -11.99% | -7.32% | -5.55% |
| U.S. Aggregate | -15.08% | -11.15% | -8.75% |
| SOURCES: Bureau of Labor Statistics, Homebase and authors’ calculations. | |||
The table shows information of employment changes relative to January for different U.S. states and for the nation. The second column shows information using CPS microdata, which corresponds to the week ending on April 17.
In April, U.S. employment was 15.1% below the January value. Our coincident index suggested that overall U.S. employment recovered significantly for the week ending May 15; it predicted that CPS employment in the middle of May was down by only 11.15% relative to the beginning of the year.
On June 5, the Bureau of Labor Statistics’ jobs report indeed showed that U.S. employment increased; CPS employment was 12.4% below the January figure compared with -15.1% in April. While the forecast was not perfect, it was well aligned with the released data.
Where Is Employment Now?
We then repeated the same exercise for the week ending on June 5 to get the most up-to-date reading of the labor market. We predict that the recovery has continued at a healthy pace and employment is now down 8.75% relative to January.
In sum, our coincident index is a simple yet powerful tool that can help us gauge the pace of the recovery and obtain real-time information of the state of the labor market.
Notes and References
1 In this post, we use the measure of employment from the Current Population Survey and not the Current Employment Statistics survey: The CPS includes the agriculture sector, private households and self-employed individuals, but the CES does not. Also, multiple jobholders are counted only once in the CPS, while each job is counted separately in the CES.
2 The daily data from Homebase reflects changes in employment relative to January. In other words, changes in employment are indexed with January as the baseline. We applied an equivalent indexing technique to the CPS data with January as the baseline.
3 Across our analysis, we aggregated daily Homebase data to weekly to smooth any intraweek variation in employment. Moreover, the data are not seasonally adjusted.
Additional Resources


This blog offers commentary, analysis and data from our economists and experts. Views expressed are not necessarily those of the St. Louis Fed or Federal Reserve System.
Email Us
All other blog-related questions
