

Child Poverty Rates in the Eighth District and Beyond
KEY TAKEAWAYS
- Child poverty is higher in the Eighth Federal Reserve District than in the rest of the country.
- Recessions, such as the one caused by COVID-19, increase child poverty and income instability.
- Changes to the federal child tax credit (CTC) may help reduce the share of children living in poverty.

Child poverty in the United States is pervasive, affecting nearly 1 in 7 children. Living in poverty is defined as having a family income below a certain threshold—adjusted for the number of adults and children in a household—and has been shown to have long-run impacts on health, education and the income children have as adults.
Changes to the federal CTC implemented in the American Rescue Plan Act of 2021 are meant to reduce childhood poverty and income instability. For this article, we looked at rates of child poverty and income volatility within the Eighth Federal Reserve DistrictThe Eighth District includes all of Arkansas, eastern Missouri, northern Mississippi, southern Illinois, southern Indiana, western Kentucky and western Tennessee. and throughout the U.S.
Child Tax Credit
The CTC, introduced in 1998, previously offered up to $2,000 per dependent younger than 16 and was refundable up to $1,400. The American Rescue Plan, which was signed into law in March, expanded the CTC for 2021 up to $3,000 per child between ages 6 and 17 and $3,600 per child younger than 6, with the entire credit being refundable.
If a refundable tax credit exceeds the amount of a family’s tax liability, the difference between the two up to the limit is given as a refund. In other words, a family with no federal income is still eligible to receive the entire tax credit. This year, all eligible families will automatically receive the full credit if they earn up to $150,000 per married couple or $112,500 for households headed by a single parent.
However, instead of a single lump-sum payment, half will be delivered in installments over the second half of the year, with the rest being claimed on tax returns. This change to the CTC is estimated to decrease by 40% the share of children living below the poverty threshold. The increased benefits, as well as the new distribution plan, could help families increase and smooth their income over the year.
A Look at the Data
The data for this article come from the Annual Social and Economic Supplement (ASEC) of the Current Population Survey (CPS). The ASEC is completed each March using the families currently in the CPS and contains detailed information on family income and earnings. Families appear in the ASEC for two consecutive years before exiting the sample.
The families can be consistently matched across years from 1978 onward. We limited our sample to households with children whose household head is between the ages of 18 and 64. The information on the poverty threshold comes from the Census Bureau and the Office of Management and Budget. They create a set of income thresholds that vary by family size and composition to determine who is living in poverty. For example, a family with two adults and two children making less than $26,246 in 2020 would be considered living in poverty.
Child Poverty in the Eighth DistrictBecause of data limitations, we are reporting data for Eighth District states as a whole, with the understanding that parts of these states, such as in Illinois, are outside the District.
The first figure shows the share of families with children under the poverty threshold for their family size over time, with periods of recession shaded in gray.The measure displayed in the first figure is the three-year moving average of the share of families with children with a total income below the poverty threshold, as calculated by the Census Bureau. We took three-year moving averages because of limits in the sample size. Since 1980, the share of families with children who are below the poverty threshold has generally been higher in the Eighth District than in the country at large (excluding a brief period in the late 1990s). Further, child poverty rates are cyclical and child poverty in the Eighth District generally increases more during recessions.
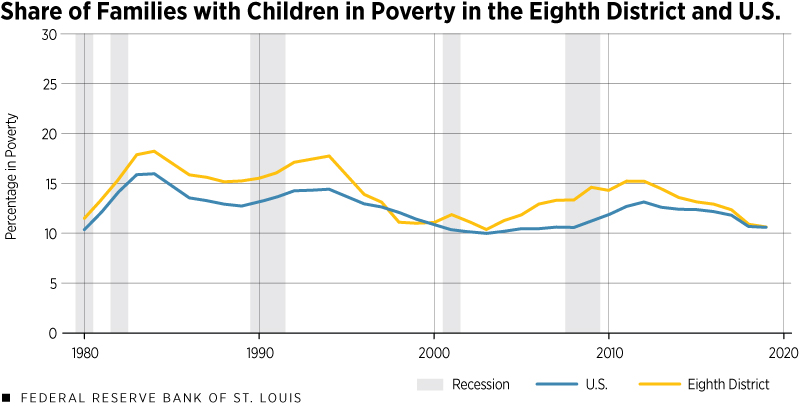
SOURCES: Annual Social and Economic Supplement of the Current Population Survey, Census Bureau and authors’ calculations.
Looking more recently, the second figure shows the average proportion of families with children in the Eighth District living below the poverty threshold over the past five years. The dark gray bar represents the average for the entire country, including the Eighth District, while the blue and green bars represent the states and the largest metropolitan statistical areas (MSAs) in the Eighth District, respectively. Illinois, Missouri, Little Rock and St. Louis all have child poverty rates below the national average. Mississippi has the highest rate of child poverty, followed by Louisville, Ky., and Memphis, Tenn.
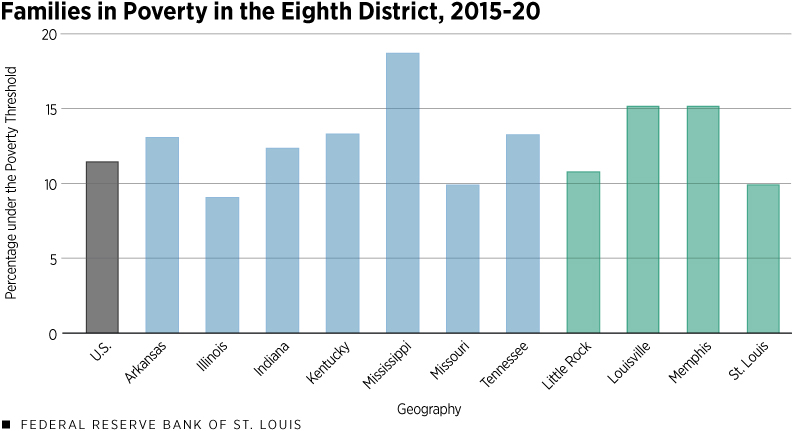
SOURCES: Annual Social and Economic Supplement of the Current Population Survey, Census Bureau and authors’ calculations.
Income Volatility in the Eighth District
While increasing the child tax credit will mainly help alleviate overall levels of poverty, another goal of the American Rescue Plan is to help reduce volatility for families with children. Income volatility for a family can come from many sources, such as inconsistent working hours, changing wages or changes in employment.
To measure income volatility, we calculated the probability of a 20% or greater drop in total family income over the course of a year. The third figure shows the three-year moving average of the probability of a large drop in total family income inside and outside the Eighth District. While the overall level of income in the Eighth District is lower than outside it, there are no significant differences between the level of income volatility between the two different areas. However, in periods of recession, the level of income volatility tends to increase more in the Eighth District.
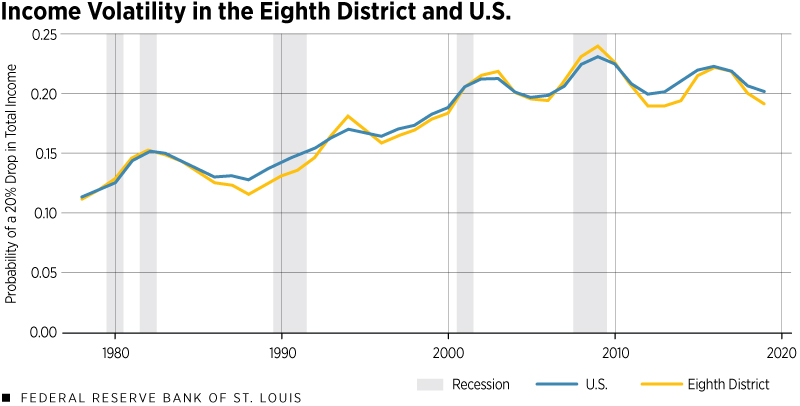
SOURCES: Annual Social and Economic supplement of the Current Population Survey, Census Bureau and authors’ calculations.
Conclusion
The increased value of the CTC and the changes to its structure will raise children out of poverty and help lower- and middle-income families smooth their incomes during the year. The share of families with children living in poverty is higher in the Eighth District than in the rest of the country, suggesting that the increased CTC may have a larger impact in the District.
While income volatility is roughly the same in the two areas, in recessions like that caused by the COVID-19 pandemic, the Eighth District struggles more with volatility and poverty. Thus, the CTC changes will be helpful to District families, even as the economy recovers.
Endnotes
- The Eighth District includes all of Arkansas, eastern Missouri, northern Mississippi, southern Illinois, southern Indiana, western Kentucky and western Tennessee.
- Because of data limitations, we are reporting data for Eighth District states as a whole, with the understanding that parts of these states, such as in Illinois, are outside the District.
- The measure displayed in the first figure is the three-year moving average of the share of families with children with a total income below the poverty threshold, as calculated by the Census Bureau. We took three-year moving averages because of limits in the sample size.


Views expressed in Regional Economist are not necessarily those of the St. Louis Fed or Federal Reserve System.
For the latest insights from our economists and other St. Louis Fed experts, visit On the Economy and subscribe.
Email Us
