

What’s behind Rising Returns to High-Quality College Education?
KEY TAKEAWAYS
- Research has focused on the financial returns to a college degree, but few studies have looked at whether the quality of the college also matters.
- An analysis of college students in the early 1980s and the early 2000s suggests that attending a high-quality college leads to higher graduation rates and income.
- These gains from college quality also appear to have risen over time.
- These rising gains may be due to a growing learning ability gap between students attending low-quality schools and those at high-quality schools.

While financial returns to a college degree have been widely studied, less is known about how much it matters where one goes to college. Yet, more than ever, college quality is perceived to be a decisive factor in determining a child’s future success. This was the motivation behind the recent “Varsity Blues” scandal, in which affluent parents were accused of bribing college officials to guarantee their children’s acceptance into top schools.
But many more parents pour significant resources into improving their children’s college prospects without resorting to illegal means. For example, private SAT tutors can cost hundreds of dollars an hour, and college application consultants charge tens of thousands of dollars for their services.See www.bloomberg.com/news/articles/2019-03-12/college-arms-race-goes-too-far-with-wealthy-gaming-the-system. One may wonder whether financial gains associated with entry into highly selective schools justify the higher tuition and college prep costs.
What is the financial gain from choosing a top-tier academic school over a lower-ranking college closer to home or even a community college? How has it evolved over time? These are important questions for policymakers and for high school students facing their most important financial investment decision. We investigate these questions.
Data Sources on Student Outcomes and College Quality
As our data sources, we employed the 1997 and the 1979 National Longitudinal Surveys of Youth (henceforth, NLSY97 and NLSY79).This research was conducted with restricted access to Bureau of Labor Statistics (BLS) data. The views expressed here do not necessarily reflect the views of the BLS. NLSY97 is an ongoing survey that tracks the lives of 8,984 millennials, many of whom entered college around 2000. The NLSY79 follows an older cohort that comprises 12,686 baby boomers, many of whom entered college around 1980.
In each survey round, the individuals answer questions on a variety of topics, including education and income. These two are the only surveys that contain complete earnings histories for at least 15 years following college graduation and allow us to identify colleges that students attended and degrees received. All survey participants were also administered an aptitude test that covered numerical operations, vocabulary, paragraph comprehension and logical reasoning.This standardized test was not a college entrance exam like the SAT or ACT.
To rank these colleges on “quality,” we compiled a comprehensive data set of over 3,000 colleges and universities in the U.S. and collected information on their average SAT scores and freshmen enrollment in 2000. The main source for this information is the Integrated Postsecondary Education Data System.See https://nces.ed.gov/ipeds for more information. For colleges with missing reports, we used average SAT scores published in Barron’s Profiles of American Colleges and American Universities and Colleges.
We categorized all colleges into four types. The lowest type (Type 1) comprises community colleges offering a transferable associate degree. Four-year institutions are ranked in terms of their freshmen’s average SAT score, from lowest to highest, and they are split into three groups based on freshman enrollment. Type 2 comprises the lowest-ranked colleges that account for a third of all freshmen; Type 3 comprises the middle-ranked colleges and Type 4 represents the top-ranked colleges, each with a third of enrolled freshmen.
We will refer to higher-type colleges as higher-quality colleges because better SAT averages not only indicate better learning (and networking) opportunities from one’s peers but also strongly correlate with measures of instructional quality (e.g., faculty-student ratios and faculty salaries).Based on authors’ calculations. We chose to include community colleges in our analysis because over a third of college entrants start in a community college, with 95% of them stating their ultimate goal is a bachelor’s degree.See Bowen et al.
According to our classification, higher-type colleges host a more strictly selected group of students, provide higher-quality instruction and cost more. We can now identify the quality type of each college attended by each survey participant. We use responses from both surveys to analyze how postsecondary education decisions and their effects on future earnings have changed over time.
Pitfalls in Assessing Financial Gains from a Specific College
A great deal of college information is available to today’s high school students, such as college graduation rates and average post-graduation salaries.See, for example, https://nces.ed.gov/ipeds/use-the-data for college characteristics or www.payscale.com/college-salary-report for salary information. Students should take caution when using graduation rates and salary data to compare financial gains or losses from enrolling in different colleges. This is because student bodies can differ vastly across colleges with regard to learning ability—a term that refers collectively to all student characteristics at the time of high school graduation that matter for both their academic success and labor market success (e.g., college preparedness, work ethic, grit, ambition).This ability should not be seen as merely the result of innate intelligence or academic potential. Learning ability can be shaped by many factors, including disparities in economic and educational opportunities, all of which are outside the scope of our analysis.
Such student composition differences partly account for graduation outcomes and salary differences across colleges and must be adjusted for when inferring personal gains from selecting one school over another.
If the highly selected Harvey Mudd College students, nearly all of whom major in science, technology, engineering and mathematics (STEM) fields, report earning $89,000 shortly upon graduation, while the graduates of the less selective University of California, Irvine earn $60,000, a student admitted to both schools who plans to study engineering should not conclude that choosing UC Irvine over Harvey Mudd would entail giving up a third of post-graduation salary.
Likewise, she should not interpret the average graduation rates (92% for Harvey Mudd and 88% for UC Irvine) to mean that her graduation probability would decline by 4 percentage points. The higher graduation rates and earnings of the Harvey Mudd students partly reflect the student composition effect—they are (on average) higher achievers who do not shy away from the more lucrative STEM fields.
To more accurately assess the expected salary associated with choosing UC Irvine over Harvey Mudd, the student in our example should compare graduation rates and average post-graduation salary for a very specific set of students—engineering majors with similar to her own high school performance, family income and parental education. Doing so would largely reduce the expected salary loss suggested by the naive calculation.
Effects of College Quality: The NLSY79 Cohort
Let’s start with a few facts about this cohort. About half of the NLSY79 high school graduates enrolled in college and about half of those who enrolled earned a bachelor’s degree. College graduates went on to earn 70% more over their lifetime than their peers who never entered college. However, this earnings gap grossly exaggerates financial gains from a college degree. After appropriate adjustments are made for student composition differences, the average gain from graduation measures at 35%.See Hendricks and Leukhina.
For the purpose of our analysis of college quality effects, we approximated student learning ability (as defined earlier) by aptitude test score percentile. This measure is practical but imprecise, and we will discuss the implications of this imprecision later. We adjusted for student composition effects by comparing outcomes across colleges for students with similar test scores.
Consistent with the intuition from the simple example discussed above, we found that the effects of high-quality colleges are exaggerated if one fails to adjust for student composition differences.
At first glance, school quality appears to have a massive influence on the probability that a student graduates from college: Only 20% of the older cohort starting out at a community college (Type 1) obtained a bachelor’s degree within six years, while the top (Type 4) schools saw 86% of their freshmen graduate, suggesting that a choice of a Type 4 college over a community college path increases graduation probability by 66 percentage points.
However, this simple analysis exaggerates the causal effect that college quality has on graduation rates. Part of the reason that the graduation rate is higher at better schools is because their students are, on average, of higher learning ability (as defined earlier)—Type 1 students scored in the 54th percentile of all high school graduates, while Type 4 students scored in the 83rd percentile.
If we compare graduation rates for students with similar aptitude test performance—thereby making an adjustment for student composition effects—we find that, on average, a student’s probability of graduating increases by 50 percentage points when he or she chooses a Type 4 college path over a community college path to a bachelor’s degree. Even though the effect is significantly reduced, it remains very large.
A similar narrative emerges when we look at how college quality affects earnings after graduation. After adjusting for work experience, we found that students who graduated from a Type 4 school earned 8% more per year than those who graduated from a Type 2 school.
However, if we make an adjustment for student composition effects using test scores, we find that Type 4 graduates earned only 5% more per year relative to their peers graduating from Type 2 colleges. As in the case of graduation outcomes, we find that college quality effects on post-graduation earnings are significantly reduced after making this adjustment, and these effects are fairly small. Note that college quality mattered greatly for graduation outcomes. Where the degree came from mattered less for earnings outcomes.
Aptitude test scores also held a strong predictive power on both graduation rates and post-graduation earnings. When comparing students entering the same type of college, we found that students with test scores in the top quartile (fourth) among high school graduates attained a bachelor’s degree at a rate that was 47 percentage points higher and earned 25% more when compared with students scoring in the bottom quartile (first).
How Did the Effects of College Quality Change over Time?
What can we say about the younger cohort who entered college in 2000—the cohort that faced greater returns to a college degree and showed greater enrollment rates? We found that the importance of college quality as a determinant of graduation rates and post-college earnings increased, while the importance of aptitude test scores declined.See also Dillon and Smith.
Figure 1 helps visualize the increasing importance of college quality for graduation outcomes. The left-hand panel of Figure 1 plots graduation rates by college quality for freshmen scoring in the lowest quartile of the test score distribution. The positive relationship between college quality and graduation rates is steeper for the younger cohort—mainly because students with low test scores performed better at higher-quality schools.
The right-hand panel tabulates graduation rates for students in the top quartile of the test score distribution. Again, the positive relationship between college quality and graduation rates is steeper for the younger of the two cohorts—mainly because high-scoring students performed worse at lower-quality schools.
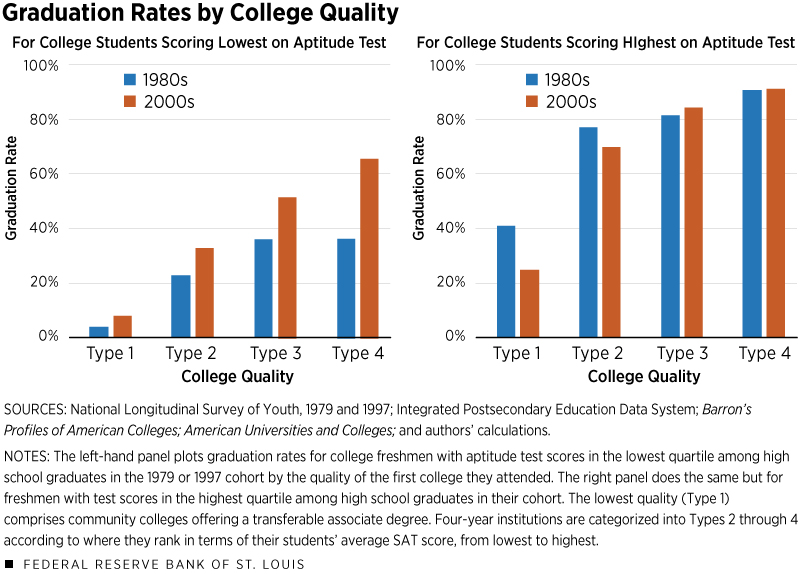
Let’s summarize the average effects for all students in a given cohort. While the older cohort faced a 50 percentage point increase in graduation probability when choosing to enroll in a Type 4 college over a community college, the younger cohort enjoyed a much larger gain of 63 percentage points.
The same trends appear in post-graduation earnings. As discussed earlier, the older-cohort students graduating from a Type 4 school went on to earn 5% more than their peers who graduated from Type 2 schools. The younger cohort, however, experienced a 10% gain—a full doubling of the return to college quality.
Figure 2 helps visualize the declining importance of aptitude test scores for graduation outcomes. It plots graduation rates against the test score quartile, for students attending the same college type. The left-hand panel shows graduation rates for students who entered community colleges, and the right-hand panel shows graduation rates for students who entered the highest type colleges.
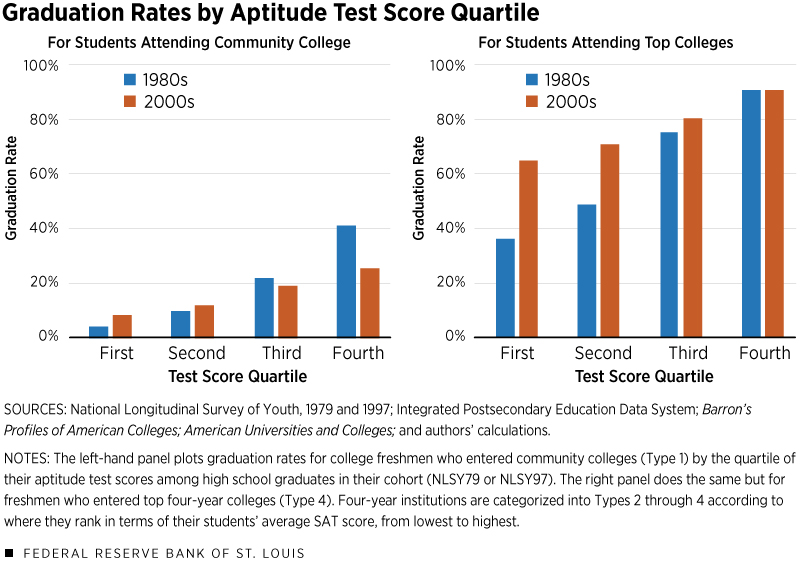
The positive relationship between test scores and graduation rates is weaker for the younger cohort—predominantly because high-scoring students starting at community colleges became less likely to transfer and graduate. The right-hand panel also reveals a weakening of the relationship between graduation rates and test scores—but the effect is mainly due to the low-scoring students performing better in top-type schools.
Thus, the younger cohort saw a decline in the importance of test score quartile as a determinant of graduation and earnings.
Let’s consider the average results for all students in a given cohort. Whereas the high-scoring students in the older cohort attained a bachelor’s degree at a rate that was 47 percentage points higher than that of their low-scoring peers, this gap dropped to 26 percentage points for the younger cohort—a decline by nearly a factor of 2. Similarly, the younger cohort saw the importance of test score quartile as a determinant of earnings reduced by a factor of 2.
What Explains the Rising Importance of College Quality?
We argue that it is highly likely that a large part of the rising importance of college quality can be attributed to rising sorting on learning ability. If the relative learning ability of students enrolled in top-quality colleges increased, this change would manifest itself in our analysis as increasing returns to college quality, in both graduation outcomes and earnings.
Let’s try to unpack this statement. In a 2018 paper, Lutz Hendricks and Oksana Leukhina found that aptitude test scores are fairly imprecise measures of student abilities. This means that by comparing outcomes across college types for students with similar test scores, as we did here, we are not comparing students with the same learning ability.
It is likely the case that low-scoring students who were accepted and enrolled in higher-quality schools are of higher learning ability than what their test scores suggest—they may have simply had a bad day when they took their tests. Thus, even though we made adjustments for student composition effects in terms of test scores, our measure of returns to college quality partly reflects the remaining student composition effects in terms of learning ability.
We will argue that this part has become more important over time as the ability gap between top- and bottom-quality colleges has widened. Let’s refer to the size of this gap as the strength of student sorting across college types. We will first explain what factors could potentially drive the increase in student sorting on ability and conclude by showing some evidence of this phenomenon.
Potential Explanations for the Rise in Student Sorting
First, the younger cohort faced a significantly greater college graduation premium, which resulted in the rise of college enrollment (from 46% of high school graduates to 57%) characterized by an influx of students with lower test scores from families of medium to higher incomes.Based on authors’ calculations and consistent with Philippe Belley and Lance Lochner, “The Changing Role of Family Income and Ability in Determining Educational Achievement.” Journal of Human Capital, Winter 2007, Vol. 1, No. 1, pp. 37–89. As a result, the variation in learning ability among college entrants increased. With less room to increase operating capacity, four-year schools increased their admission standards, and lower-ability students became more likely to enroll in community colleges with open-door admission policies.
Second, tightening financial constraints may have also played a role in increasing sorting. We documented that the average tuition paid by freshmen increased by a factor of 3 for the younger cohort, from $4,000 to $13,552.In 2000 dollars. Because tuition is not reported in NLSY79, we obtained tuition estimates for the older cohort from the High School and Beyond survey, conducted by the National Center for Education Statistics. Even though the amount of grants and scholarships also increased, the direct cost of college more than doubled, from $3,628 to $8,624. (See Endnote 12 for details.)
In the meantime, the increase in the borrowing limits for subsidized Stafford loans did not keep up with the rising college costs. The borrowing limit for the first year of college barely changed at all, increasing from $2,500 in 1982 to $2,625 in 2000, although the annual loan limit increased more for subsequent years in college.
As a result, the younger cohort had to rely more heavily on family transfers, work more hours while in college and enroll in less-expensive colleges. Such downgrading of college choice would disproportionately affect the less-college-ready students as they tend to come from lower-income families. In addition, low-ability students with limited financial resources would be more likely to downgrade their college choice when faced with less time left to study, as it would be more difficult for them to keep up with school work in top colleges.
Finally, it is possible that the true return to a degree from higher-quality schools increased, perhaps as a result of increased expenditures on faculty, advising and career services. As a result, we would expect to see upgrading of college choice predominantly among the high-ability students—as these students can more easily keep up with stricter learning standards.
All of these factors have likely contributed to the widening in the learning ability gap between top- and bottom-quality institutions. As a result, the performance of students attending top-quality schools rises in terms of both graduation rates and earnings relative to the performance of students at bottom-quality schools. Put differently, a choice of a high-quality college has become a better indicator of higher student ability and would manifest as rising returns to college quality.
Evidence of Rising Student Sorting
Consistent with the explanations above, we found evidence of increased student sorting. Figure 3 compares college sorting between our two cohorts. The left-hand panel shows the fraction of lowest-scoring students who began college at each type of school. In both groups, a majority of students started at community colleges, but that share increased from just over a half of the older cohort to nearly three-quarters of the younger cohort.
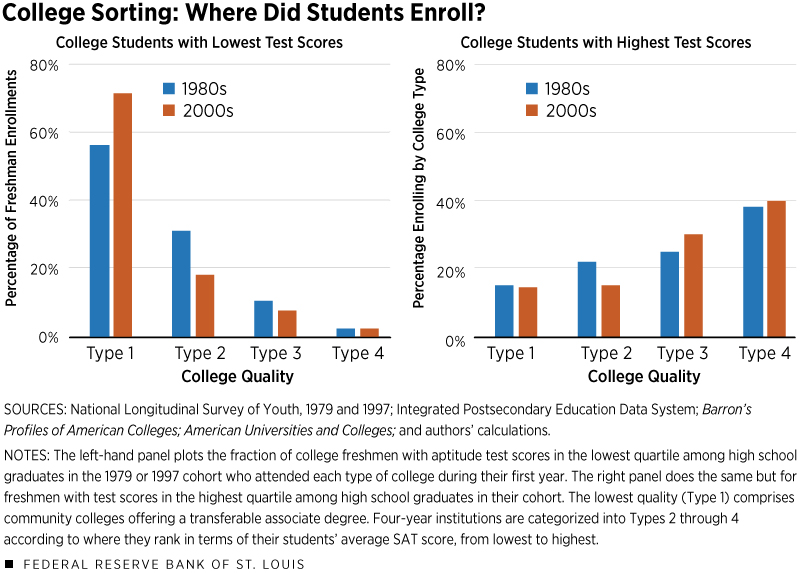
In contrast, the right-hand panel shows that a larger share of highest-scoring students in the younger cohort enrolled as freshmen in the top two college types.
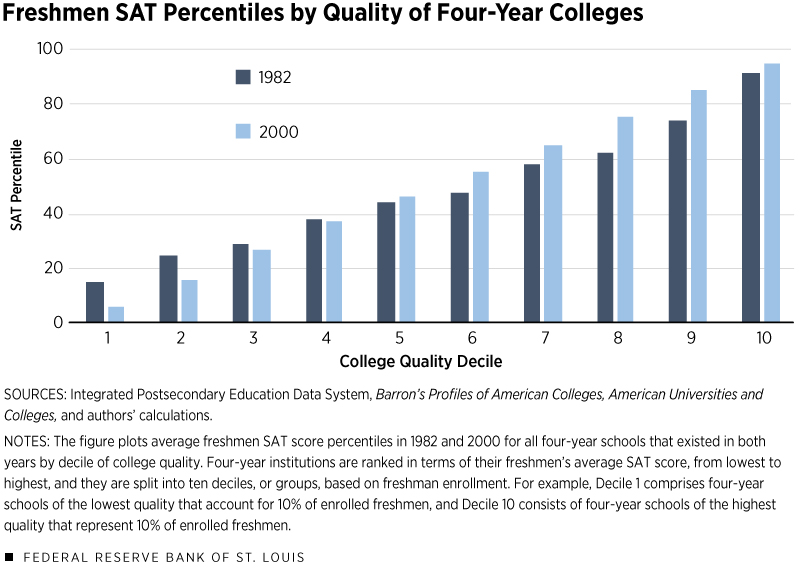
While most of the action seems to concentrate in the rise of the community college track among lowest-scoring students, we also saw a substantial increase in sorting among four-year schools. Figure 4 plots the average freshmen SAT score percentile by college quality (defined by the decile of their rank, using the methodology in the section titled “Data Sources on Student Outcomes and College Quality”) for all four-year schools. We clearly see the relative decline of student ability in lower-quality schools.
Conclusions
We showed that the effects of high-quality colleges are exaggerated if one fails to adjust for student composition differences. When making the adjustment, the effects appear smaller and work mainly through increasing one’s graduation chances—where one’s degree comes from matters less for post-college earnings.
However, we also demonstrated that returns to college quality increased over time and argued that a large part of this increase is explained by the widening learning ability gap between students attending low-quality schools and students attending high-quality schools. We put forward several plausible explanations for this phenomenon, such as tightening financial constraints and the rising graduation premium. More work is needed to disentangle the role of these factors.
Endnotes
- See www.bloomberg.com/news/articles/2019-03-12/college-arms-race-goes-too-far-with-wealthy-gaming-the-system.
- This research was conducted with restricted access to Bureau of Labor Statistics (BLS) data. The views expressed here do not necessarily reflect the views of the BLS.
- This standardized test was not a college entrance exam like the SAT or ACT.
- See https://nces.ed.gov/ipeds for more information.
- Based on authors’ calculations.
- See Bowen et al.
- See, for example, https://nces.ed.gov/ipeds/use-the-data for college characteristics or www.payscale.com/college-salary-report for salary information.
- This ability should not be seen as merely the result of innate intelligence or academic potential. Learning ability can be shaped by many factors, including disparities in economic and educational opportunities, all of which are outside the scope of our analysis.
- See Hendricks and Leukhina.
- See also Dillon and Smith.
- Based on authors’ calculations and consistent with Philippe Belley and Lance Lochner, “The Changing Role of Family Income and Ability in Determining Educational Achievement.” Journal of Human Capital, Winter 2007, Vol. 1, No. 1, pp. 37–89.
- In 2000 dollars. Because tuition is not reported in NLSY79, we obtained tuition estimates for the older cohort from the High School and Beyond survey, conducted by the National Center for Education Statistics.
References
American Universities and Colleges. Westport, Conn.: Praeger Publishers, 1983.
Barron’s Profiles of American Colleges: Descriptions of the Colleges. 1980-1992. Barron’s Educational Series Inc.
Bowen, William G.; Chingos, Matthew M.; and McPherson, Michael S. Crossing the Finish Line: Completing College at America’s Public Universities. Princeton, N.J.: Princeton University Press, 2009.
Dillon, Eleanor; and Smith, Jeffrey. “The Consequences of Academic Match between Students and Colleges.” Journal of Human Resources, (forthcoming).
Hendricks, Lutz; and Leukhina, Oksana. “The Return to College: Selection and Dropout Risk.” International Economic Review, August 2018, Vol. 59, No. 3, pp. 1077-1102.


Views expressed in Regional Economist are not necessarily those of the St. Louis Fed or Federal Reserve System.
For the latest insights from our economists and other St. Louis Fed experts, visit On the Economy and subscribe.
Email Us
