

Growth in Tech Sector Returns to Glory Days of the 1990s
Over the past 25 years, the U.S. economy has undergone a profound technological revolution, characterized as a “palpable historic change” by former Federal Reserve Chairman Alan Greenspan.1
Innovations in digital computing systems and automation have triggered tectonic shifts in consumer and business behaviors across the economy, and at the core of this disruption has been a small yet rapidly expanding class of firms, entrepreneurs and innovators. In this article, we present a snapshot of the technology sector and its recent dynamics, as well as of its presence in the St. Louis Fed’s District.
The technology sector comprises industries that are primarily focused on developing and producing advanced technology for the rest of the economy. Businesses like Google, IBM and Microsoft are some of the largest businesses in the U.S. tech sector. Although dozens of other companies outside the tech sector make use of modern innovations—and may even have their own research and development departments—most nontech firms use those innovations to provide traditional goods and services. For instance, an auto manufacturer today may use advanced robotics to assemble cars more efficiently, but the manufacturer’s primary output is cars, not the robotic assembly lines.
In our analysis, we define the technology sector as the combination of seven industries as outlined in the North American Industry Classification System and as laid out by researchers at the Federal Reserve Bank of New York.2 Table 1 displays these industries, along with the nation’s and the District’s top revenue-generating firms within each.
The National Scene
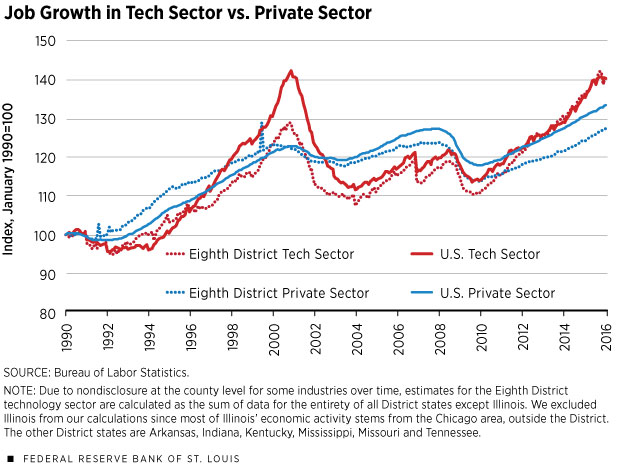
The technology sector has a dynamic history of expansion and contraction. Its first high-growth period lasted from 1990 to 2000, a time traditionally thought of as the “dot-com boom” or the “tech bubble.” National employment in technology sector industries shot up by 36 percent over the period. (See Figure 1.) Average weekly wages for technology sector workers doubled, rising by 102 percent over the 10-year period. At its peak in 2000, tech employment accounted for just over 4 percent of total private employment.
After the tech bubble burst in early 2001, technology sector employment declined rapidly, experiencing significant net job losses for four straight years. By the time it bottomed out in 2004, the sector’s workforce had shrunk by 17.8 percent and the tech employment share had declined to 3.4 percent.
From 2004 to 2008, the tech sector experienced modest job growth, in step with the rest of the private sector. But in 2009, the tech sector suffered a major contraction, which was tied to the financial crisis and subsequent recession.
Since the Great Recession (2007-09) ended, the technology sector has experienced robust expansion in employment and moderate growth in wages. From 2010 to 2015, jobs in the sector expanded by 20.3 percent (see Table 2) compared with just 11.1 percent growth in employment for the private sector. In 2015, U.S. tech sector employment reached 4.6 million, pushing the tech share to 3.9 percent of total employment, effectively matching its level in 2000.
Tech sector wages have also markedly improved, rising roughly 5 percent each year since 2010. Historically, tech-sector wages have exhibited substantial premiums over average private-sector wages. In 1990, the earnings markup in the technology sector was roughly 1.6, meaning that tech-sector workers earned $1.60 in wages for every $1 earned by the average private-sector worker. However, this wage gap has widened over the past 25 years. Since 2010, average weekly wages in the tech sector have been at least double the private-sector level; in 2015, the tech-sector wage markup reached a record 2.2.
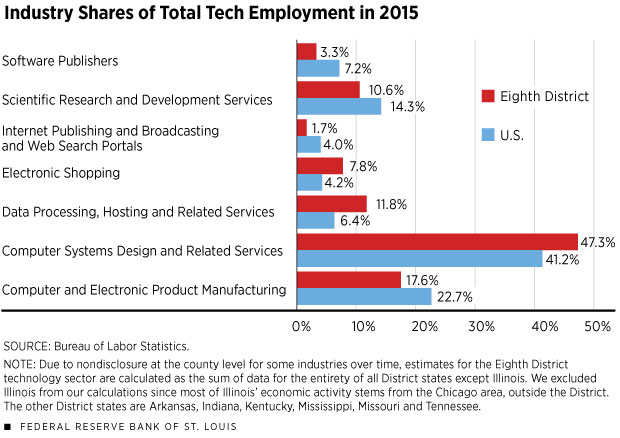
The distribution of employment across tech-sector industries has been continuously shifting since 1990. Until 1996, the majority of tech employment was in manufacturing, accounting for approximately 60 percent of the high-tech workforce. However, service firms have come to dominate the tech economy. Today, nearly 80 percent of tech workers are in services, with the computer systems design industry accounting for the largest fraction of total tech jobs (41 percent).
In terms of its geographic distribution, tech-sector employment is often more concentrated in metro areas. In 2015, the San Jose metropolitan statistical area (MSA) in California had the largest concentration of tech workers (21 percent). Boulder, Colo., had the second-largest share (18 percent), followed by San Francisco (11 percent). Together, the San Jose and San Francisco MSAs make up the bulk of what is known as Silicon Valley and are home to 9 percent of all technology sector employment in the U.S.
In a sample of the 100 largest U.S. metro areas, technology sector wages in 2015 were highest in the San Jose, San Francisco and Seattle MSAs. In 2015, workers in tech industries averaged earnings of approximately $4,500 per week in San Jose, $3,500 per week in San Francisco and $3,000 per week in Seattle.
The District’s Tech Sector
By comparison, the technology sector has a modest presence in the Eighth Federal Reserve District, home of the St. Louis Fed. In 2015, the tech employment share in the District was an estimated 2.1 percent. Although this figure is below the national average, the District’s share has been increasing over the past 25 years.
As Figure 1 shows, employment growth in the District’s technology sector has outpaced the District’s overall private sector growth since the Great Recession, pushing the District’s tech share from 1.7 percent to 1.8 percent between 2005 and 2010 and then up another 0.3 percentage points by 2015. While that change may appear minute, it represents a shift of nearly 41,000 workers into tech industries in just five years. Figure 2 illustrates that in 2015, the industry breakdown within the District’s tech sector aligned closely with the nation’s.
Of the Eighth District's four largest metro areas (see Table 2), the St. Louis MSA had the largest tech sector in terms of gross employment in 2015. St. Louis tech workers also earned the highest wage premium, collecting double the average weekly wage of general private-sector workers in St. Louis. Louisville, Ky., had the fastest-growing technology sector out of the four; employment in these industries has surged by more than 52 percent since 2010, reaching nearly 12,500 in 2015. Meanwhile, tech-sector wages have been rising most rapidly in Memphis, Tenn. In just five years (2010-15), the average weekly wages of technology sector workers in Memphis jumped from approximately $1,200 to $1,500.
Even though Little Rock, Ark., the fourth-largest MSA in the District, had a tech share equal to St. Louis’ in 2015, the metro area’s tech workforce actually shrank 6 percent from 2010 to 2015. The biggest employment losses were in data-processing services, which accounted for over 60 percent of gross job losses in the area. Wages in high-tech industries in Little Rock were strong in 2015, however, and grew at a healthy tempo of 13.5 percent from 2010 to 2015.
Conclusion
This article shows that the tech-sector industries have been growing rapidly over the past several years and have the capacity to help bolster economic growth going forward. While the tech sector is small in size, it plays a critical role in driving innovation and productivity growth, and the sector generates disproportionate economic spillovers. The tech workforce is also one of the most highly skilled labor pools in the economy, and high demand for tech workers has been a key driver of wage growth.
Charles Gascon is a regional economist, and Evan Karson in a research associate, both at the Federal Reserve Bank of St. Louis. For more on Gascon’s work, see https://research.stlouisfed.org/econ/gascon.
Top Revenue-Producing Firms by Technology Industries (2015)
| NAICS Codes | Industry Title | Largest Public Tech Firm in the U.S. | Largest Public Tech Firm in the Eighth District |
|---|---|---|---|
| 334 | Computer Manufacturing | Apple | Kimball Electronics (Jasper, Ind.) |
| 454111 | Electronic Shopping | Amazon | CafePress (Louisville, Ky.) |
| 5112 | Software Publishing | Microsoft | Amdocs* (Chesterfield, Mo.) |
| 518 | Data Processing, Hosting and Related Services | Xerox | Acxiom (Conway, Ark.) |
| 51913 | Internet Publishing and Broadcasting and Web Search Portals | Inuvo (Little Rock, Ark.) |
|
| 5415 | Computer Systems Design | IBM | Jack Henry & Associates (Monett, Mo.) |
| 5417 | Scientific Research and Development Services | QuintilesIMS | Biomedical Systems* (Maryland Heights, Mo.) |
SOURCES: Compustat, Dow Jones.
NOTE: “Largest Public Tech Firm” lists the public company with the largest reported revenue in 2015 for each North American Industry
Classification System (NAICS) family of industries.
*Using Dow Jones’ Factiva Companies and Industries Database, these firms were identified as having the most revenue among Eighth District
firms in the corresponding family of NAICS codes. No corporations in the Compustat database qualified for this field.
Selected Tech Sector Statistics
| Region | Total Tech Employment (2015) | Technology Employment Share (2015) | Employment Growth (2010-15) | Wage Premium (2010-15) | Wage Growth (2010-15) |
|---|---|---|---|---|---|
| National | 4,631,634 | 3.9% | 20.3% | 2.2 | 20.8% |
| Eighth District* | 227,085** | 2.1% | 26.3% | 1.8 | 10.5% |
| St. Louis | 32,592 | 2.9% | 5.3% | 2.0 | 7.7% |
| Memphis, Tenn.† | 4,542 | 0.9% | 7.8% | 1.5 | 16.3% |
| Louisville, Ky. | 12,485 | 2.3% | 52.4% | 1.4 | 9.2% |
| Little Rock, Ark.‡ | 7,531 | 2.9% | –6.1% | 1.6 | 13.5% |
SOURCE: Bureau of Labor Statistics
NOTE: “Wage Premium” is calculated as the employment-weighted average of the average weekly wages for the seven tech sector industries divided by the average weekly wage for private sectors. The numbers in bold are the highest values among the MSAs for each category.
* Due to nondisclosure at the county level for some industries over time, estimates for the Eighth District technology sector are calculated as the sum of data for the entirety of all District states except Illinois. We excluded Illinois from our calculations since most of Illinois’ economic activity stems from the Chicago area, outside the District. The other District states are Arkansas, Indiana, Kentucky, Mississippi, Missouri and Tennessee. District estimates using county and metro area data range from 1.3 percent to 2.4 percent.
** Total tech employment for the District is calculated as 2.1 percent of total private employment in Eighth District Counties.
† Industry employment shares for Shelby County, Tenn., were used to estimate nondisclosed NAICS industries for the metro area.
‡ Industry employment shares for Pulaski County, Ark., were used to estimate nondisclosed NAICS industries for the metro area.
Endnotes
- See Greenspan. [back to text]
- See Bram and Ploenzke. [back to text]
References
Bram, Jason; and Ploenzke, Matthew. “Will Silicon Alley Be the Next Silicon Valley?” Federal Reserve Bank of New York’s Liberty Street Economics, July 6, 2015.
Greenspan, Alan. “Technology and the Economy.” Before the Economic Club of New York, Jan. 13, 2000.

Views expressed in Regional Economist are not necessarily those of the St. Louis Fed or Federal Reserve System.
For the latest insights from our economists and other St. Louis Fed experts, visit On the Economy and subscribe.
Email Us
