

The Composition of Long-term Unemployment Is Changing toward Older Workers
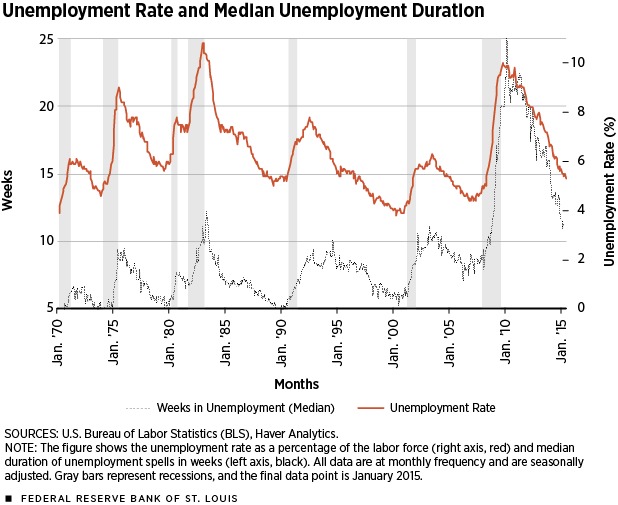
The Great Recession (2007-09) led not only to much higher numbers of unemployed workers, but also, and more dramatically, to much longer spells of unemployment for the unemployed. Figure 1 shows that between 1970 and the start of the Great Recession, the median duration of unemployment never exceeded 12 weeks. At the end of 2007, it was only eight weeks. After that, the median unemployment spell reached 25 weeks, more than twice the maximum since 1970.1 Furthermore, while in recent periods the unemployment rate has recovered toward its historic average, the median unemployment spell has stubbornly remained high. Indeed, a large fraction of the unemployed are likely to be long-term unemployed (LTU), for which the standard definition is a continuous unemployment spell of 26 weeks or longer.
The cross-age distribution of the LTU is disproportionately concentrated toward two types of people: an older group, those aged about 50 years, and a younger group, those aged about 23 years. This "bimodality" is present before and after the Great Recession. In this article, we examine changes in the incidence of LTU across different age groups before and after the Great Recession. We found that among the unemployed, younger and older people were more likely to enter LTU than middle-aged people during the recession. Since the recession ended, the LTU rates for older and younger workers have stayed further above their prerecession rates than have the rates of middle-aged workers. As a result, the pool of the long-term unemployed has become considerably more concentrated in these two age groups. Additionally, a postrecession shift toward the older group has led to a noteworthy aging of workers in LTU. The average worker in LTU went up from 38.3 years old in 2006-2007 to 40.1 years old in 2012-2013.2
From the point of view of aggregate productivity, the aging of the pool of unemployed workers may aggravate the persistence in the mismatch between the set of skills that employers demand and the skills of available workers. Arguably, older workers may find it more difficult—and less rewarding—to upgrade their skills and catch up with innovations in technology. From the point of view of individual welfare, entering LTU can have lasting negative consequences for both young and old workers. Yet the nature of the effects can be quite different. For younger workers, who are in the early stages of their careers, the "scars" from LTU might have a long-lasting impact on their lifetime earnings.3 For older workers, LTU would have a smaller impact on lifetime earnings, but the consequences could be catastrophic for those with low assets and who were counting on the last years of work to save for retirement.
LTU before and after the Great Recession
The Current Population Survey (CPS) asks respondents for their current labor force status and, if they are unemployed, the length of their unemployment spells. We extended the typical classification of workers—young, prime and old—by dividing prime-age workers into two groups. Thus, our overall classification contains four age categories: young workers (16 to 24 years), young prime-age workers (25 to 44 years), old prime-age workers (45 to 54 years) and old (55+). We also reported the statistics for prime-age workers as a whole.
The table uses the CPS responses to report the ratio of LTU to total unemployment for each of the different age categories, all for the months of January for three different years: 2005, 2010 and 2015. The first column of data in the table shows these shares for January 2005, a prerecession year with an overall unemployment rate of 5.3 percent. The likelihood of entering LTU increases with age, from 16 percent for the young to as high as 27 percent and 25 percent for the two oldest groups of workers.
Columns 2 to 4 show how these values changed dramatically over the next decade, during and after the Great Recession. In January 2010, when the unemployment rate was 9.8 percent, the LTU-to-unemployment ratios were almost twice as high for all age groups. However, the most severely affected were the younger prime and oldest workers, with ratios rounded to 125 percent and 110 percent higher than the 2005 levels. The other two groups, the young and older-prime people, were also affected, but the ratio of LTU to total unemployment went up by only 83 percent and 72 percent, respectively, relative to five years before.
By January 2015, the overall unemployment rate had fallen to 5.7 percent, and all age groups had experienced a drop in their LTU-to-unemployment ratios. However, none of the age groups reverted to their January 2005 levels. Young workers and older-prime workers were the ones closer to fully recovering, with LTU-to-unemployment ratios 29 percent and 37 percent above the January 2005 levels. As during the recession, the two groups that were hit hardest were the younger-prime age and the old workers. They remained 73 percent and 60 percent above the 2005 levels, respectively. The unemployed workers between 25 and 44 who were driven into LTU will bear significant scars for the 20-40 years remaining in their work careers. For the oldest workers, who may not have the skills currently in demand by employers, disaster may be looming because of the combination of much harder times finding a job and the collapse of housing values and retirement funds.
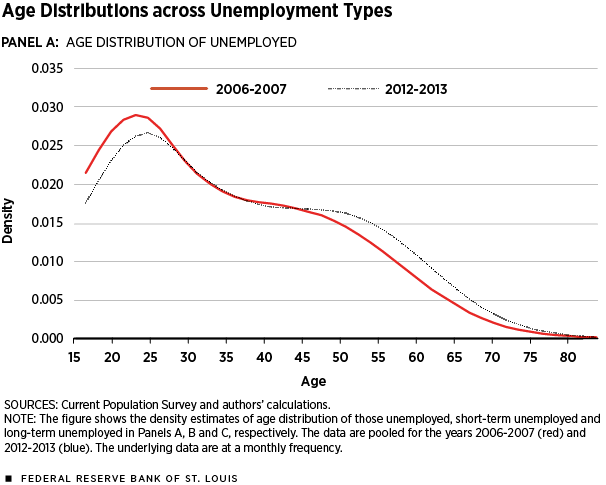
The longer unemployment durations and changes in the age composition of the labor force have led to changes in the age composition of the unemployed, as shown in Panels A-C of Figure 2. All these panels compare the age distribution of the unemployed before and after the Great Recession. To abstract from the temporary disruptions of the recession per se, we considered the periods two years before and two years after the Great Recession.
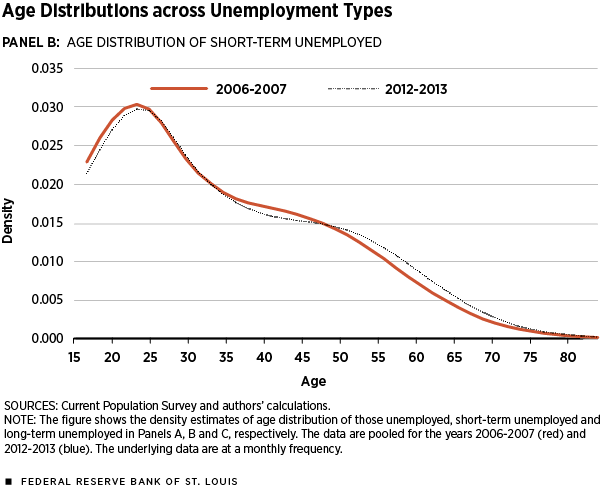
Figure 2 shows three different subgroups of unemployed: all unemployed workers are in Panel A; short-term unemployed (STU) workers, i.e., unemployed but not LTU, in Panel B; and LTU in Panel C. Panel A shows the age distribution of all unemployed workers shifting to the right, i.e., the unemployed workers are getting older. This aging is largely driven by a positive increase in the share of workers over 50 years of age and a decline in the relative mass of workers younger than 25. This may purely be a reflection of the decline in youth labor force participation and concurrent rise in older worker labor force participation during these years. Most interestingly, these shifts are driven almost entirely by LTU and not STU.4 As shown in Panel B, the age distribution for STU workers has barely moved during these years.
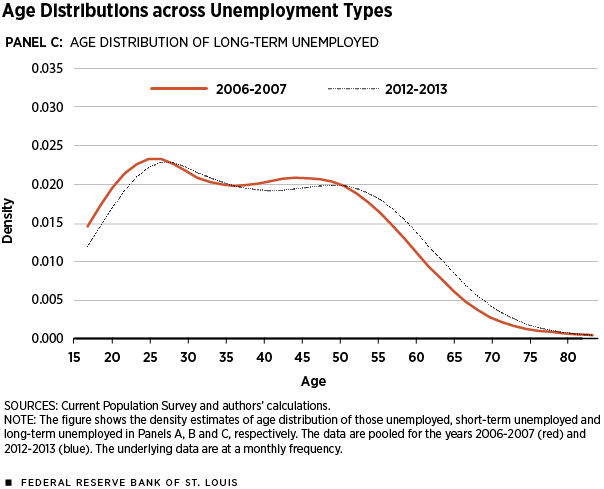
Panel C of Figure 2 shows the age distribution for those in LTU. As mentioned above, for both periods, before and after the recession, the age distribution of LTU is bimodal, affecting mostly the very young and the very old. However, the concentration of young workers declines following the recession. On the contrary, workers over the age of 50 accounted for a much larger share of LTU after the recession. Moreover, the older mode has become as much as 10 years older, from the mid-40s to the mid-50s. The figure also shows that all those 55 and older have significantly increased their presence in the ranks of long-term unemployed workers.
Conclusion
We found that the recession was particularly harsh for two age groups of unemployed workers: those aged 25-44 and those 55 or older. Earlier this year, these two groups remained further from their prerecession LTU levels than other age groups. We further showed that older workers have become a more prominent group among the LTU population. The higher median unemployment duration spell is not uniform across age groups but has hit more intensively those older workers, including some that, while into retirement age, are still seeking employment.
Endnotes
- Changes in the measurement of unemployment duration by the Bureau of Labor Statistics (BLS) contributed slightly to the rise in median duration observed in Figure 1. However, only about three weeks of the increase could be accounted for by this. See Valletta and U.S. BLS for details. State-level extensions for unemployment insurance eligibility have been shown by Farber and Valletta to contribute to up to one quarter of the incidence in LTU. However, Rothstein found that these extensions increased the share of long-term unemployed by between 0.3 and 2.8 percentage points. [back to text]
- The increase in average age is slightly stronger for female workers in LTU. The differences in the mean ages are statistically significant. [back to text]
- See Bell and Blanchflower for the long-term impact of LTU on youth. [back to text]
- See Toossi for recent trends and projections in labor force participation across age groups. Additionally, the difference between the shifts in age distribution of STU and LTU compared to all unemployed workers suggests that the shifts toward older workers' being LTU is not entirely due to labor force participation trends. [back to text]
References
Bell, David N.F.; and Blanchflower, David G. "Young People and the Great Recession." Oxford Review of Economic Policy, Vol. 27, No. 2, 2011, pp. 241-67.
Farber, Henry S.; and Valletta, Robert. "Do Extended Unemployment Benefits Lengthen Unemployment Spells? Evidence from Recent Cycles in the US Labor Market." Working Paper No. w19048, National Bureau of Economic Research, 2013.
Rothstein, Jesse. "Unemployment Insurance and Job Search in the Great Recession." Working Paper No. w17534, National Bureau of Economic Research, 2011.
Toossi, Mitra. "Labor Force Projections to 2020: A More Slowly Growing Workforce." Monthly Labor Review, Bureau of Labor Statistics, January 2012, pp. 43-64.
U.S. Bureau of Labor Statistics. 2011. "Changes to Data Collected on Unemployment Duration."
Valletta, Robert. "Long-term Unemployment: What Do We Know?" FRBSF Economic Letter, February 2013.

Views expressed in Regional Economist are not necessarily those of the St. Louis Fed or Federal Reserve System.
For the latest insights from our economists and other St. Louis Fed experts, visit On the Economy and subscribe.
Email Us
