

Where Did All the New Liquidity Go?
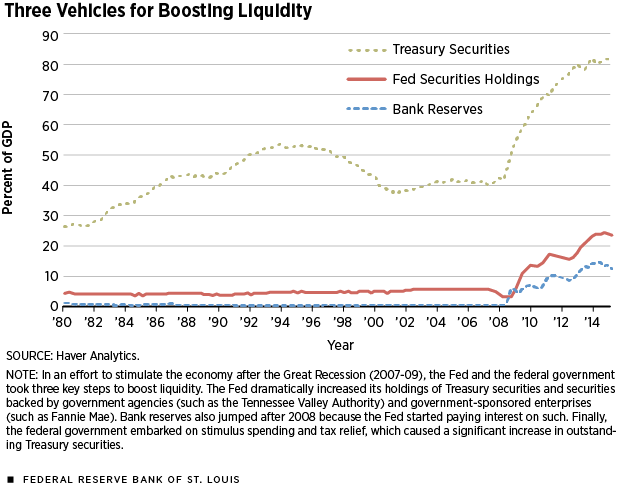
In response to the Great Recession (2007:Q4-2009:Q2), the Federal Reserve and the federal government implemented policies that dramatically altered the liquidity structure of the economy. Three such policies stand out, as summarized in Figure 1.
First, successive rounds of quantitative easing, starting in late 2008, greatly expanded the monetary base as the Fed purchased large amounts of securities. The holdings of U.S. Treasury securities plus securities backed by agencies and government-sponsored enterprises (GSEs) went from 5 percent of gross domestic product (GDP) in 2007:Q4 (about the historical average) to 24 percent of GDP as of 2015:Q2.1 Second, the payment of interest by the Fed on bank reserves, which also started in late 2008, combined with banks' own change in behavior, increased bank reserves from almost zero to 13 percent of GDP as of 2015:Q2. Third, the federal government attempted to stimulate the economy with a mix of increased spending and tax relief.2 The resulting deficits implied a significant increase in government debt: The stock of Treasury securities went from about 41 percent of GDP in 2007:Q4 to 80 percent of GDP in 2015:Q2.3 (Treasury securities expand available liquidity since they are widely accepted as collateral in credit and financial transactions, such as repos, and allow agents to economize on cash balances.)
On the surface, these policies have greatly expanded liquidity. A presumed benefit of such an expansion is easier access to credit, which could boost economic activity; a perceived cost is the risk of higher inflation. Whether these policies succeeded in stimulating the economy is debatable. Whatever the merits of these policies, however, GDP is still below its prerecession trend, and growth has slowed down significantly. At the same time, some may find it puzzling that inflation has not yet skyrocketed and, instead, has been below the target of 2 percent annualized.
These outcomes may be explained, in part, by inconsistencies in how expansionary policy was implemented.4 While the federal government has indeed issued significantly more debt, a nontrivial share was acquired by the Fed itself. Similarly, the Fed purchased large amounts of securities from banks, which, in turn, were given incentives to keep the proceeds in their balance sheets by virtue of being paid interest on reserves. It appears plausible, then, that a significant part of the recent liquidity expansion did not find its way to those economic actors that would find such liquidity useful, i.e., households and businesses. It should then not be surprising that inflation has not picked up and that inflation expectations remain depressed. Essentially, there was no excess supply of money competing for goods and services to drive up prices. In what follows, I will provide support to this argument by quantifying how the liquidity expansion was distributed among relevant economic groups.
The creation of liquidity is in the hands of a few actors, which are either in charge of conducting policy or directly affected by policy and financial regulation. These actors include the government (at all levels), the Fed, depository institutions, money market mutual funds and GSEs. On the other side are the users of this liquidity: households, nonfinancial businesses, other financial institutions (pension funds, mutual funds, insurance companies, etc.) and the rest of the world. How have the liquidity holdings of the users been affected by policy?
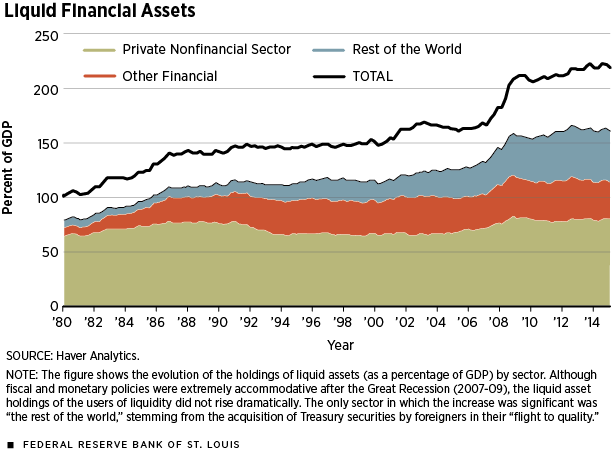
Figure 2 shows the evolution of liquid financial assets, in terms of GDP, by sector. All data are from the Financial Accounts of the United States (the "flow of funds"). The assets included are currency, checkable deposits, savings and time deposits, money market funds shares, Treasuries, and agency- and GSE-backed securities. Three sectors or groups are shown: the private nonfinancial sector (households and businesses), other financial institutions (i.e., the financial sector excluding the Fed, depository institutions, money market mutual funds and GSEs) and the rest of the world.5 The consolidated total, which incorporates all excluded sectors (i.e., the creators of liquidity), is also shown for reference.6
The picture painted by Figure 2 is considerably less dramatic than one would have anticipated given the policy innovations described above and displayed in Figure 1. Liquid financial assets held by the domestic sectors (households, businesses and other financial institutions) show a small, but permanent increase: from 108 percent of GDP in 2007:Q4 to 113 percent in 2015:Q2. All of this increase is due to a rise in savings and time deposits owned by households, which had been steadily increasing since 2000. If we were not counting savings and time deposits, we would instead see a temporary bump in this sector's liquid assets holdings, around the time of the financial crisis and the subsequent recession, but no permanent increase.
When we include the rest of the world, the increase in liquidity during the recession is more prominent, going from 139 percent in 2007:Q4 to 160 percent in 2015:Q2. This follows from a significant expansion in the stock of Treasury securities held by foreigners. Note that these holdings have been steadily increasing since the 1980s but accelerated dramatically starting in mid-2007, most likely due to flight-to-quality considerations, i.e., a worldwide increase in the demand for safe financial assets. In other words, most of the liquidity expansion was acquired by a sector (the rest of the world) that was hungry for it—supply and demand moving together.
In sum, although fiscal and monetary policies have been unprecedentedly expansionary, the liquid asset holdings of the users of liquidity have not increased dramatically. If anything, the response appears comparatively muted and consistent with pre-existing trends. Combined with a possible increase in the worldwide demand for safe, U.S. dollar-denominated assets, it should perhaps be not too surprising that inflation has remained low and stable and that nominal interest rates have remained low. It is still an open research question of how much of these outcomes can be attributed purely to inconsistencies in the implementation of government policy and how much to the response of private agents to changes in the economic environment and policy.
Endnotes
- U.S. Treasury securities are debt instruments issued by the U.S. Department of the Treasury. Securities backed by agencies and government-sponsored enterprises are debt instruments issued by a federal budget agency (such as the Tennessee Valley Authority) or a GSE (such as Fannie Mae). [back to text]
- For further details, see Martin (2013, 2014). [back to text]
- Treasury securities comprise debt held by the public (including the Fed) and by federal government employee retirement funds. Notably, this category does not include holdings by federal agencies, such as the Social Security Trust Funds. Although debt levels vary across definitions, the increase since 2007 is similar regardless of the one used. [back to text]
- For a complementary explanation, which focuses on the conceptual merits of QE, see Williamson. [back to text]
- To be clear, "other financial institutions" include insurance companies, pension funds, mutual funds (except money market), security brokers and dealers, among others. [back to text]
- "Consolidated" means that there is no double counting. For example, a household holding $100 worth of mutual fund shares, which in turn represent claims to holdings of $100 worth of Treasuries, counts only as $100 worth of total consolidated liquid financial assets. [back to text]
References
Martin, Fernando M. "A View from the Fiscal Cliff." The Federal Reserve Bank of St. Louis' The Regional Economist, April 2013, Vol. 21, No. 2, pp. 10-11.
Martin, Fernando M. "The Federal Budget: How the U.S. Got Here, and Where It Is Headed." The Federal Reserve Bank of St. Louis' The Regional Economist, July 2014, Vol. 22, No. 3, pp. 10-11.
Williamson, Stephen D. "Monetary Policy Normalization in the United States." Federal Reserve Bank of St. Louis' Review, 2015:Q2, Vol. 97, No. 2, pp. 87-108.

Related Topics
Views expressed in Regional Economist are not necessarily those of the St. Louis Fed or Federal Reserve System.
For the latest insights from our economists and other St. Louis Fed experts, visit On the Economy and subscribe.
Email Us
