

Youth Labor Force Participation Continues To Fall, but It Might Be for a Good Reason
The aggregate labor force participation (LFP) rate measures the share of the civilian, noninstitutionalized population (16 years and older) that is either employed or nonemployed but looking for work. The LFP rate reached its peak of 67.1 percent in 2000 and has been declining since, accelerating during the Great Recession.
Workers between 16 and 24 years of age constitute the demographic group that has experienced one of the most substantial declines in labor force participation. Figure 1 shows participation rates for these youth since 1955. The LFP rate for this group increased more or less steadily until 1979, reaching 68.8 percent in September 1979, then remained above 65 until 2000 before starting its sharp decline.1 The rate was down to 54.9 percent in September 2014. Was the decline homogeneous across different subsets of youth? The question is important: If a larger fraction of young people are attending school today than in the 1980s or 1990s, then the currently low labor force participation rate of youth might signal good news, implying a more-skilled prime-working-age labor force and possibly higher aggregate LFP rates in the future. On the other hand, if young potential workers are neither in the labor force nor in school, incorporating them into the labor force in the future might not be an easy task.
In this article, we review the trends in youth labor force participation by age, gender and education, focusing on the distinction between those in school and those not in school.
Less Education=Bigger Decline
There are two distinct age groups among these youth: those between 16 and 19 years old and those between 20 and 24 years old. A large share of the first group is transitioning from high school to college; thus, one should expect low labor force participation rates for this group. Workers between 20 and 24 years old are, instead, transitioning from college to either graduate school or to the labor market; thus, one should expect the LFP rate of this group to be closer to the LFP rate of the prime working-age population.
As can be seen in Figure 2, the 16-19 group experienced a large decline from 1998 until 2014 in the LFP rate, from 52.8 percent to 34.2 percent, a decrease of 35.2 percent. For the 20-24 group, the LFP rate declined from 77.5 percent to 71 percent, a decrease of 8.4 percent.
The decline in the LFP rate was similar for men and women, 17.1 percent for men and 15.2 percent for women for the entire 16-24 group.
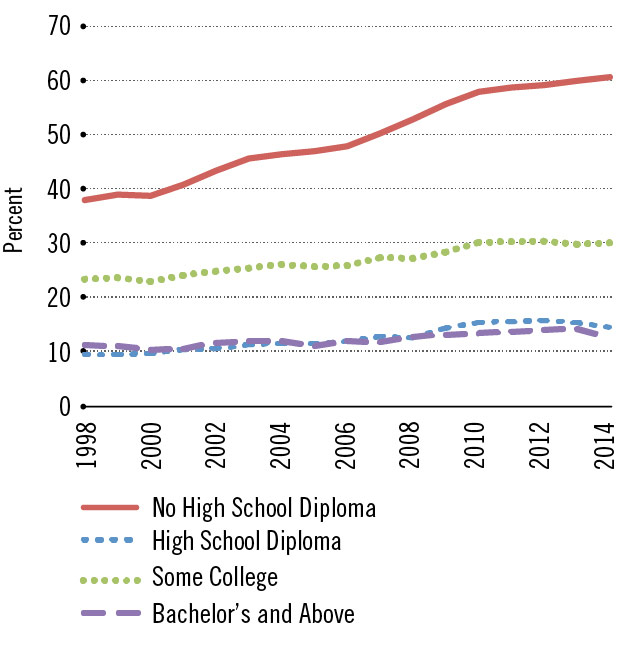
Figure 3 shows that the decline of youth labor force participation was not homogeneous across education groups. Those between 16 and 24 with less than a high school diploma experienced the largest decline in the LFP rate: from 50.3 percent in 1998 to 29.8 percent in 2014, a 40.8 percent decrease. This decline was primarily driven by people 16-19; their LFP rate declined by 45.4 percent. Young people with at most a high school diploma also experienced a significant decline of their LFP rate, from 78.2 percent to 68.4 percent. The 16-19 group drove this decline, as well. Those with some college experienced a decline similar to that of high school graduates. Finally, young workers with at least a college degree did not experience significant changes in their LFP rate; it decreased from 84.5 percent in 1998 to 82.4 percent in 2014.
In School or Not in School?
Because of their ages, many of those not in the labor force (nonparticipants) are expected to be still in school. But are they? In the Current Population Survey, conducted by the Census Bureau for the Bureau of Labor Statistics, a young individual who is out of the labor force can, in principle, be classified as either in school, not in school, disabled or retired.2 A young individual who is not in school of any kind and not working is often referred to by the acronym NEET: Not in Education, Employment or Training.
The decline in youth labor force participation corresponds to a higher fraction of them attending school. Figure 4 shows that school attendance for the 16-24 population without a high school diploma increased from 38 percent in 1998 to 60 percent in 2014. This increase was driven by the younger population. While 39.8 percent of those 16-19 were attending school in 1998, 58.5 percent of them were attending school in 2014. (School attendance for the 20-24 population increased significantly less, going from 11.6 percent in 1998 to 17.4 percent in 2014.)
The second most-prevalent reason for not being in the labor force was NEET. Among those in the 16-19 group, 6.1 percent were NEET in 2014; for those in the 20-24 group, 9.2 percent were NEET in 2014. Lower-educated individuals (those with a high school diploma at most) were more likely to be NEET.
The fraction of NEET did not change significantly from 1998 until 2014 for the entire 16-24 population. But its relative stability masks heterogeneous trends across education groups. (See Figure 5.) Although the NEET fraction for those with less than a high school diploma decreased by about 1 percentage point between 1998 and 2014, the NEET fraction increased significantly for the population with a high school diploma (in particular for the 16-19 group, whose percentage rose from 8.2 percent in 1998 to 12.4 percent in 2014) and for the population with some college education.
Interestingly, the 16-24 population with at most a high school diploma has some noticeable incidence of disability. This is not observed for the young population with at least some college.
In conclusion, the data from the Current Population Survey show that since 1998 most of the decline in youth labor force participation corresponds to an increase in school attendance (in particular of the 16-19 population). The fraction of the NEET population did not change significantly over this period, but within education groups the trends have been different. A more-detailed study of these labor trends among youth is needed to understand the future incorporation of these people into the labor market.
Labor Force Participation Rate: 1955-2014
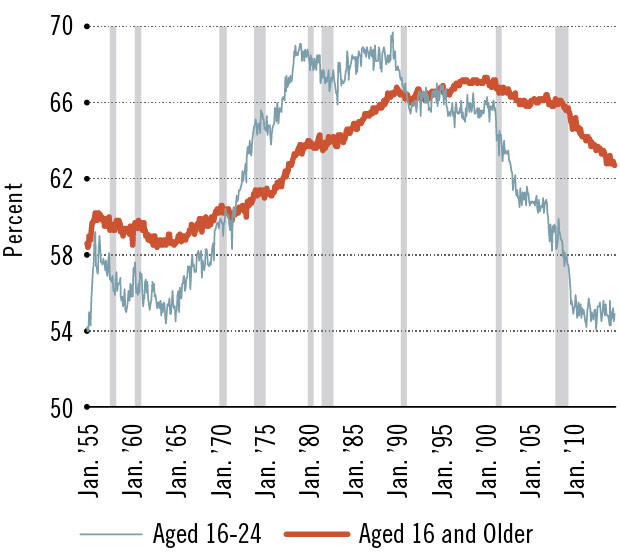
SOURCES: Organization for Economic Cooperation and Development (OECD) and Federal Reserve Economic Data (FRED).
NOTE: The gray bars represent recessions. The final data point is from September 2014.
Labor Force Participation Rate
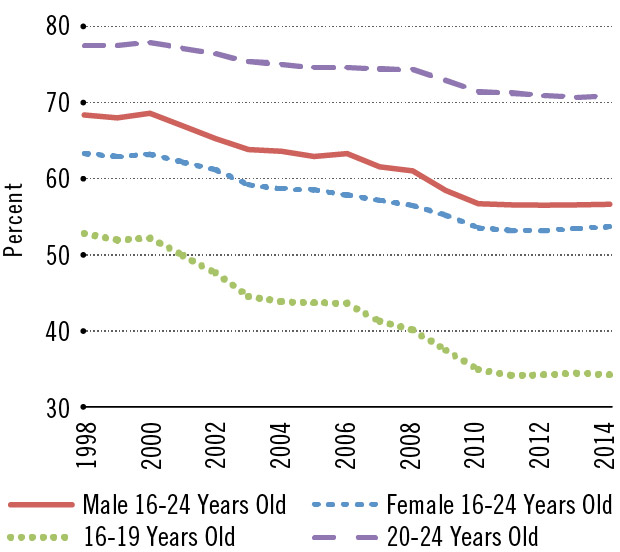
SOURCES: U.S. Bureau of Labor Statistics (BLS) and National Bureau of Economic Research (NBER).
NOTE: The data start in 1998 for this and the remaining figures because that's the earliest year for which the needed microdata from the Current Population Survey are available. The 2014 numbers are calculated using the average of the numbers from January through September.
Labor Force Participation Rate

SOURCES: BLS and NBER.
NOTE: The 2014 numbers are calculated using the average of the numbers from January through September.
In School to Population Ratio: 16-24
SOURCES: BLS and NBER.
NOTE: The 2014 numbers are calculated using the average of the numbers from January through September.
NEET to Population Ratio: 16-24
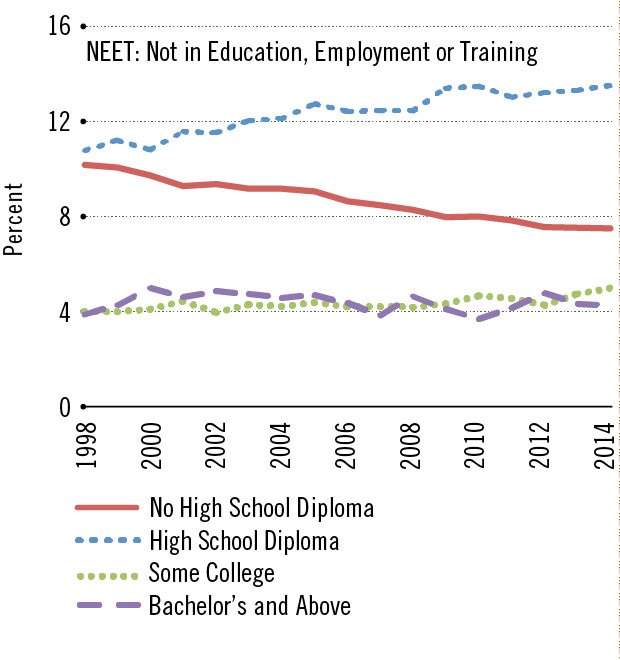
SOURCES: BLS and NBER.
NOTE: The 2014 numbers are calculated using the average of the numbers from January through September.
Endnotes
- See Canon, Debbaut and Kudlyak for an analysis on the decline of the aggregate labor force participation rate. [back to text]
- Being retired is one of the options given to everyone who is asked in the Current Population Survey why he or she is are not working. Fewer than 0.03 percent of young people pick this option. [back to text]
Reference
Canon, Maria; Debbaut, Peter; and Kudlyak, Marianna. "A Closer Look at the Decline in the Labor Force Participation Rate." Federal Reserve Bank of St. Louis' The Regional Economist, October 2013, pp. 10-11. See https://www.stlouisfed.org/publications/regional-economist/october-2013/a-closer-look-at-the-decline-in-the-labor-force-participation-rate.
Views expressed in Regional Economist are not necessarily those of the St. Louis Fed or Federal Reserve System.
For the latest insights from our economists and other St. Louis Fed experts, visit On the Economy and subscribe.
Email Us
