

Immigration: The Characteristics of Green Card Holders
KEY TAKEAWAYS
- From 1989 to 2017, Mexico was the largest source of U.S. lawful permanent residents, or green card holders. Other big sources were China, the Philippines and India.
- While many green cards are given to family members of U.S. citizens and permanent residents, a large number also go to skilled workers.
- Green card holders, on average, are younger than the overall U.S. population. They could help support an aging U.S. population in the future.

One of the pillars of the U.S. immigration system is its permanent residency program. More commonly, immigrants in this category are known as green card holders.We will use the terms “green card holder” and “permanent resident” interchangeably in the article. A key feature of this program is that the green card holder has authorization to work and stay indefinitely in the U.S. as long as certain requirements are met. A central long-term feature of this program is that it provides a pathway to citizenship, in which the person can apply to become a naturalized U.S. citizen after a number of years of residence.
In addition to benefiting the immigrant, these features present costs and benefits for society at large. For industries suffering a shortage of workers, a program like this can provide much-needed relief through the supply of a permanent and potentially skilled workforce. On the other hand, if the program creates a glut in certain labor markets, outcomes for natives could worsen.
Looking into the future, the U.S. sees a large fraction of its workforce nearing retirement (i.e., the baby boomers). The permanent residency program, especially in the case of green card holders who are at working age or younger, contributes workers who can pay into the Social Security system to sustain the elderly.
Clearly, the more we know about the characteristics of green card holders that are relevant to such economic outcomes, the better we can infer about the effects of legal immigration on the U.S. economy. Accordingly, this article looks into some relevant characteristics of U.S. green card holders based on available evidence.
The Allocation of Permanent Resident Status
The U.S. Immigration and Nationality Act of 1965 and subsequent legislation established worldwide annual limits on the number of immigrants to be granted permanent residency. Immediate relatives of U.S. citizens (e.g., spouse, parents or children under the age of 18) and refugees are exempted from this limit. For the rest, there are preference categories and annual national origin limits.For details, see the Department of Homeland Security report.
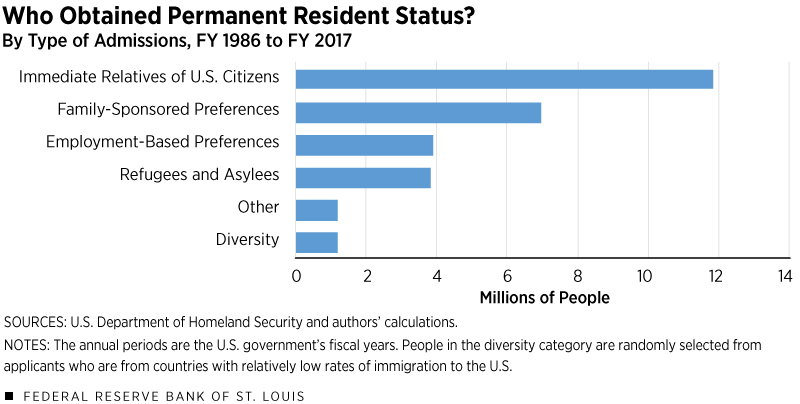
Figure 1 shows that by far the largest number of green cards since fiscal year 1986 through fiscal year 2017 was given to immediate relatives of U.S. citizens. This is followed by the category of family-sponsored preferences, which includes the adult children of U.S. citizens and the spouses and children of green card holders. Employment-based preferences garnered the third-largest number of green cards; this category is designed to attract a talented and skilled workforce to the country, with the highest preference given to outstanding professors and researchers, among others. This was followed by several other categories, including refugees and asylees.
Origin Nations of Permanent Residents
Mexico is the largest source nation of permanent residents, with nearly 171,000 green cards given to people born in Mexico in 2017.Tables and charts related to this section are available from the authors on request. Mexico has been the leading source of lawful permanent residents (LPRs) every year since fiscal year 1989, accounting for 20.5% of those receiving this status; 1989 is the earliest year for which we could get data related to source nations. However, the share of green cards received by Mexican nationals in the last 10 years, from 2007 to 2017, is lower (14.4%) compared with the overall share from 1989 to 2017. China (5.7%), the Philippines (5.4%), India (5.3%) and the Dominican Republic (3.6%) follow Mexico as the major sources of LPRs over the 1989-2017 period.
Occupations of U.S. Permanent Residents
The accompanying table provides occupational details of the green card holders in fiscal year 2017. Excluding the “unknown” category, for which information is absent, the largest category is students or children at 23.6%, followed by homemakers at 12.7%. This makes sense considering the fact that immediate relatives of U.S. citizens (i.e., spouses and dependent children) are automatically eligible for permanent residency. Furthermore, a green card holder’s spouse and dependent children get preference in receiving green cards. The category of management, professional and related occupations is 10.1% of the total, which reflects to some degree the preference given to skills in the allocation of green cards.
| People | Percentage | |
|---|---|---|
| Students or Children | 266,526 | 23.6% |
| Homemakers | 143,149 | 12.7% |
| Retirees or Unemployed | 115,889 | 10.3% |
| Management, Professional and Related Occupations | 114,218 | 10.1% |
| Production, Transportation and Material-Moving Occupations | 42,745 | 3.8% |
| Sales and Office Occupations | 41,284 | 3.7% |
| Service Occupations | 28,021 | 2.5% |
| Construction, Extraction, Maintenance and Repair Occupations | 12,867 | 1.1% |
| Farming, Fishing and Forestry Occupations | 12,594 | 1.1% |
| Military | 44 | 0.0% |
| Unknown | 349,830 | 31.0% |
| TOTAL | 1,127,167 |
SOURCES: U.S. Department of Homeland Security and authors’ calculations.
NOTE: The annual period is the U.S. government’s fiscal year.
Age Profile of Green Card Holders
The fact that the largest category in the accompanying table (excluding the category of unknown) comprises students and children is encouraging from an economic dependency standpoint; today’s students can contribute to a skilled future workforce that can pay into the Social Security system. Delving deeper into this issue, we present Figure 2. Around 22% of the total number of permanent residents in fiscal year 2017 were younger than 20, which is comparable with the 25.2% share of this age group in the total U.S. population. This group will gradually enter working age and contribute to future U.S. national income.
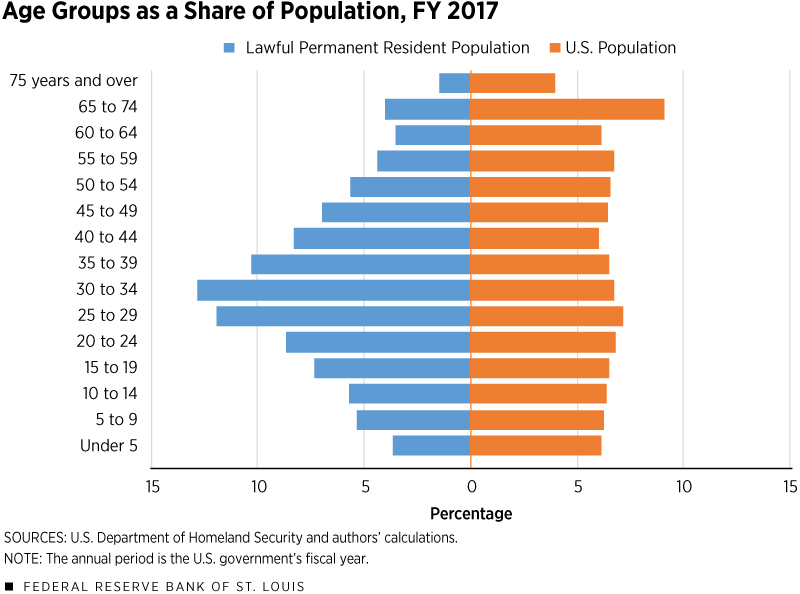
The group older than 54 represents around 13.4% of permanent residents, compared with 25.9% for that age group within the total U.S. population. The older members of this group are already retired or will start retiring in the coming years, adding—all things being equal—to the nation’s dependency burden. Therefore, the fact that the share of this group among green card holders is smaller than the corresponding share for the U.S. as a whole is encouraging in terms of the nation’s future dependency burden.
Conclusion
Our analysis reveals that while a large fraction of green cards have been given to family members of both U.S. citizens and green card holders, a substantial number have also gone to employment-based categories. As demand grows for skills that give the U.S. a competitive edge in the global economy, this program may be further leveraged to attract talented and skilled foreign workers and students. On the other hand, this might moderate the wage increases that would go to the native population in the absence of such immigration.
Immigration and trade both raise income distribution issues, which pose difficult choices to policymakers. Unlike trade, immigration involves international movement of people with potentially different languages and cultural backgrounds. This presents both social concerns and opportunities for the host nation. That discussion, although important, is beyond the scope of this article.
Finally, our analysis shows that green card holders, on average, are younger than the national population, with a substantial number being students or children. This bodes well for the future, when an aging U.S. population can be supported by younger and skilled entrants into its labor force.
Endnotes
- We will use the terms “green card holder” and “permanent resident” interchangeably in the article.
- For details, see the Department of Homeland Security report.
- Tables and charts related to this section are available from the authors on request.


Related Topics
Views expressed in Regional Economist are not necessarily those of the St. Louis Fed or Federal Reserve System.
For the latest insights from our economists and other St. Louis Fed experts, visit On the Economy and subscribe.
Email Us
