

Multifamily Housing Shows Strong Growth, Leading to Bubble Fears
The commercial real estate industry has experienced robust growth since the end of the Great Recession (2007-09). Property prices have grown steadily and are now at their pre-recession peak in real terms, on pace to surpass historical highs. Similarly, vacancy rates have declined consistently over the same period. The multifamily vacancy rate is at a 30-year low.
Construction has ramped up over the past few years in response to the lack of supply in the market. Since 2012, real (inflation-adjusted) private fixed investment in commercial structures has increased by more than 13 percent per year on average. (Still, it has yet to catch up to the level of activity seen in the decade leading up to the Great Recession, the latest recession we’ve had.) There has also been brisk lending by commercial banks, with the amount of real estate commercial loans approaching its previous peak in real terms.
This strong growth in asset prices and lending markets has caused the industry to receive increased attention by Fed officials over the past year or so. Since December 2015, the Board of Governors has issued supervisory guidance to commercial banks regarding commercial real estate. Then, in late August, Boston Fed President Eric Rosengren gave a speech in which he warned of “building pressure” in commercial real estate as a result of a low interest rate environment. He specifically pointed out the striking rise in multifamily property prices.
In this article, we look at the factors driving growth in the multifamily market, analyze the signs of a potential bubble and compare national trends with those in the Eighth District.
Multifamily Is Especially Strong
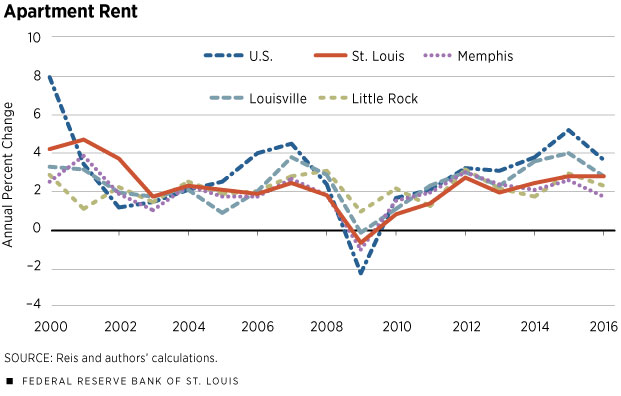
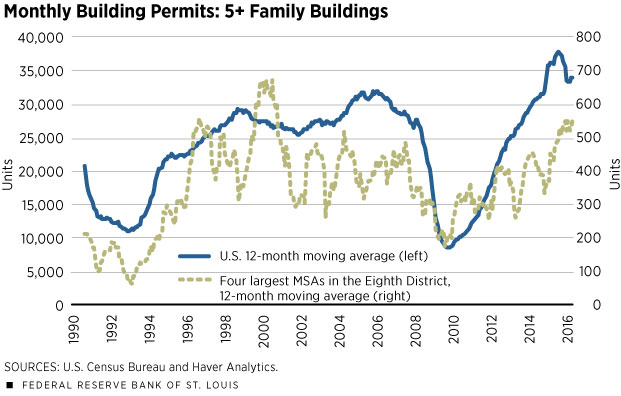
Of all the major commercial real estate categories, the multifamily market has strengthened the most since the last recession. Real property prices have exceeded their pre-recession peak, increasing at a faster rate than office and retail property prices. Multifamily rents have been growing about 3 to 4 percent per year since 2012, much faster than general prices. (See Figure 1.) Construction activity has accelerated in the past few years; multifamily starts are currently above the levels seen in the mid-2000s, and completions are not far behind. (See Figure 2.)
This recent growth appears to be the result of both an increase in demand for, and decrease in supply of, multifamily units following the collapse of the housing market and the recession that followed. Demand for renting accelerated in large part because many households were displaced due to foreclosures. Poorer job prospects and tighter lending standards also made buying a house more difficult. Consequently, more and more individuals turned to renting over homeownership, as demonstrated by the steady decline in the homeownership rate since 2005 of those under 65.
Other trends have also consistently increased multifamily demand over the past 15 years. One such tendency is that households continue to delay the purchase of their first home for various reasons, for example waiting longer to marry and have kids, thus renting for longer periods of time. While young adults have been the main drivers of demand, the gradual aging of the population has also fueled demand in the past few years. Baby boomers have shown a greater predisposition to rent as they get older; demand is rising not just for regular apartments but for senior-living facilities.1
On the supply side, there was a sharp drop in construction activity during the Great Recession as builders went out of business and banks were less willing to lend. So, as demand began to experience significant growth, there was a severe fall in new units entering the market, leading to a large gap between demand and supply. Construction activity picked up after the recession ended, but six years passed before the amount of new multifamily units entering the market each month matched levels seen prior to the recession.
Is There a Bubble?
The strong appreciation in property prices and the sharp increase in lending activity are cited as warning signs that an asset bubble may be forming in the multifamily market. While these trends are driven by fundamentals, there is a risk that investors’ expectations for future demand are unrealistically high. Some of this stems from concerns that low interest rates have led to riskier lending as investors seek higher yields, a point brought up by Rosengren in his speech. Although the number of renting households has steadily increased since 2005, there is a good chance that demand growth will slow to a more sustainable level once the homeownership rate stabilizes. That could happen sooner rather than later because millennials—even though they are renting more now than did previous generations at the same point in their lives—say that they want to be homeowners eventually.2
A slowdown in demand should be relatively modest as other demand drivers remain strong. The number of adults 18-34 years of age—the age group with the highest propensity to rent—is projected to rise, and the data suggest that more young adults are starting to move out of their parents’ houses. The American population will also continue to age, adding demand at that end as well, as baby boomers downsize. Such a slight slowdown in demand growth should allow supply to adjust to the change smoothly.
Local Growth More Modest
Post-recession growth in commercial real estate prices has been much more modest in the Midwest than in the rest of the country. Real prices are still about 20 percent below the previous peak, right in line with levels seen from 2000 to 2005. In contrast, prices in the other three Census Bureau regions are above or just below their previous high points.
Construction activity has also been relatively more moderate. In the four largest metropolitan statistical areas within the Eighth District (Little Rock, Ark.; Louisville, Ky.; Memphis, Tenn.; and St. Louis), the number of nonresidential construction projects and the amount of space under construction have ramped up in recent years, but both remain below pre-recession peaks.
Despite this slower growth relative to the nation, commercial real estate demand remains strong. Local real estate contacts have generally reported year-over-year increases in the demand for most property types over the past eight quarters. Much of this demand growth is concentrated in industrial property because the region is a distribution hub.
A similar story presents itself when zeroing in on the multifamily market. Rent growth in the region has been fairly moderate. Within the District’s four largest MSAs and the Midwest region, rent has grown about 2-3 percent per year since 2012, closer to the average increase in overall prices than average rent growth in the nation. (See Table 1.) Louisville has seen slightly more robust rent growth in recent years, most likely because the MSA’s economy is generally outperforming the rest of the region.
Trends in local vacancy rates are analogous. (See Table 2.) The multifamily vacancy rates in Louisville and St. Louis have closely mirrored that of the nation since the end of the last recession, declining swiftly before stabilizing at relatively low levels, between 4 and 5 percent. On the other hand, rates in Memphis and Little Rock are currently at more elevated levels, about 7 percent. Little Rock’s higher rate is due to a significant influx of newly constructed units from 2012 to 2014, causing the vacancy rate to increase by more than 2 percentage points during that time period. The metro's vacancy rate has been trending down since.
Multifamily construction has also had a more modest run-up in the Eighth District compared with what’s happening in the nation as a whole. Apartment completions in the four major MSAs combined have recovered to the levels of activity witnessed before the recession but have stopped there. Meanwhile, national completions have increased well beyond their average in the mid-2000s.
Still, there are risks of overbuilding in the District. Multifamily building permits have recently begun to exceed their pre-recession average in the four largest MSAs. Anecdotal evidence suggests that much of the new investment is coming from outside the region. If these outside investors do not have a solid understanding of the more modest drivers of growth in local markets, there is a risk that some of these new projects may be excessive.
Charles Gascon is a regional economist, and Joseph McGillicuddy is a senior research associate, both at the Federal Reserve Bank of St. Louis. For more on Gascon’s work, see https://research.stlouisfed.org/econ/gascon.
Selected Average Annual Growth Rates
| Average Annual Growth Rate (%) | |||
|---|---|---|---|
| Region | 2000-2007 | 2012-2016 | |
| Real Commercial Real Estate (CRE) Prices | U.S. (All) | 5.1 | 5.5 |
| U.S. (Apartment) | 5.7 | 5.4 | |
| U.S. (Industrial) | 5.4 | 6.2 | |
| U.S. (Office) | 4.5 | 5.0 | |
| U.S. (Retail) | 5.8 | 5.1 | |
| East (All) | 5.5 | 3.3 | |
| Midwest (All) | 1.4 | 2.2 | |
| South (All) | 4.1 | 6.0 | |
| West (All) | 7.6 | 7.9 | |
| Real CRE Private Fixed Investment | U.S. | –0.2 | 13.4 |
| Real CRE Loans | U.S. | 9.9* | 4.8 |
| Apartment Rent | U.S. | 3.4 | 3.8 |
| Little Rock | 2.1 | 2.5 | |
| Louisville | 2.4 | 3.1 | |
| Memphis | 2.2 | 2.3 | |
| St. Louis | 2.9 | 2.5 | |
| Core Consumer Price Index | U.S. | 2.2 | 1.9 |
| Midwest | 1.8 | 1.6 | |
| St. Louis | 2.0 | 1.5 | |
*Data starts in 2004.
SOURCES: National Council of Real Estate Investment Fiduciaries (NCREIF), Bureau of Economic Analysis, Federal Reserve Board of Governors, Reis, Bureau of Labor Statistics and Haver Analytics.
NOTES: East, Midwest, South and West are Census Bureau regions; Little Rock, Louisville, Memphis and St. Louis are the four largest MSAs in the St. Louis Fed’s Eighth District. Growth in CRE prices is calculated from NCREIF transactions-based price indexes adjusted for inflation using the gross domestic product (GDP) deflator. CRE loans are adjusted for inflation using the consumer price index. Calculations for 2012-2016 used data only through the third quarter.
Selected Average Values
| Region | 2000-2007 | 2013 | 2016 | |
|---|---|---|---|---|
| CRE Private Fixed Investment (Billions of chained 2009 dollars, seasonally adjusted annual rate) |
U.S. | 229 | 136 | 201 |
| Homeownership Rate (%) | U.S. | 68.3 | 65.1 | 63.3 |
| Eighth District | 72.8 | 69.5 | 68.1 | |
| Apartment Vacancy Rate (%) | U.S. | 5.6 | 4.3 | 4.4 |
| Little Rock | 6.3 | 7.2 | 7.0 | |
| Louisville | 7.9 | 4.5 | 5.0 | |
| Memphis | 9.3 | 8.6 | 7.7 | |
| St. Louis | 6.5 | 4.8 | 4.1 | |
| Industrial Availability Rate (%) | U.S. | 10.1 | 11.4 | 8.6 |
| St. Louis | 9.3 | 13.0 | 7.8 | |
| Office Vacancy Rate (%) | U.S. | 14.0 | 16.9 | 16.0 |
| Little Rock | 11.5 | 11.7 | 12.1 | |
| Louisville | 14.0 | 15.2 | 14.4 | |
| Memphis | 17.3 | 23.0 | 23.0 | |
| St. Louis | 15.5 | 18.0 | 16.6 | |
| Monthly Building Permits: 5+ Unit Buildings (Units) | U.S. | 28,422 | 27,019 | 32,309 |
| Eighth District | 428 | 288 | 537 |
SOURCES: Bureau of Economic Analysis, U.S. Census Bureau, Reis, CBRE Group Inc. and Haver Analytics.
NOTES: Little Rock, Louisville, Memphis and St. Louis are the four largest MSAs in the Eighth District. The Eighth District homeownership rate is the weighted average of the homeownership rates for all states in the District excluding Illinois (since most of that state’s economic activity–and population–stems from the Chicago area, outside of the District). The District’s other states are Arkansas, Indiana, Kentucky, Mississippi, Missouri and Tennessee. Eighth District monthly building permits are the sum of permits for the Little Rock, Louisville, Memphis and St. Louis MSAs. Calculations for 2016 used data only through the third quarter.
Endnotes
- See Rappaport for further discussion. [back to text]
- See Shahdad. [back to text]
References
Rappaport, Jordan. “Millennials, Baby Boomers, and Rebounding Multifamily Home Construction.” Federal Reserve Bank of Kansas City’s Economic Review, Second Quarter 2015, Vol. 100, No. 2, pp. 37-55.
Rosengren, Eric S. “Observations on Financial Stability Concerns for Monetary Policymakers.” Speech at the Shanghai Advanced Institute of Finance, Beijing, China, Aug. 31, 2016.
Shahdad, Sarah. “What Younger Renters Want and the Financial Constraints They See." Fannie Mae’s Perspectives, May 5, 2014. See www.fanniemae.com/portal/research-insights/perspectives/050514-shahdad.html.


Views expressed in Regional Economist are not necessarily those of the St. Louis Fed or Federal Reserve System.
For the latest insights from our economists and other St. Louis Fed experts, visit On the Economy and subscribe.
Email Us
