

Recession Signals: Four Housing Indicators to Watch in 2019
KEY TAKEAWAYS
- Recent movements in several housing indicators resemble those seen in the late stages of past economic expansions.
- Not all housing indicators point to a slowdown.
- Key indicators to watch include mortgage rates, existing home sales, real house prices and the momentum of residential investment.
Economist Edward E. Leamer famously observed in August 2007 that “housing is the business cycle.” See Learner, Edward E. “Housing Is the Business Cycle.” Economic Policy Symposium Proceedings: Housing, Housing Finance, and Monetary Policy, Federal Reserve Bank of Kansas City, August 2007, pp. 149-233. He was quickly proved right, as the housing-driven Great Recession began in December 2007.In this analysis, we designate the start of the Great Recession as the first quarter of 2008, since it was the first full quarter of recession.
Housing downturns have preceded every U.S. recession since World War II. For example, one measure of the momentum of residential investment turned negative before each of these episodes. Other housing-related measures likewise have a track record of forecasting broader economic trends.
Recent movements in several housing indicators—mortgage rates, existing home sales, real house prices and the momentum of residential investment—resemble those seen in the late stages of past economic expansions. Could these storm clouds gathering over the housing market be signaling a broader economic downturn in 2019 or 2020?
(Editor's note: The analysis contained in this article was updated for a blog post "Key Housing Indicators Weaken Further in 2019," published June 24, 2019.)
Housing Market as Predictor of Recession
Several housing indicators currently suggest another housing downturn may be on the horizon. A broader economic recession is by no means inevitable, however, since some past episodes of housing weakness have proved to be false alarms. Still, based on its forecasting track record—where a housing downturn is necessary but not sufficient for a recession to occur—the risk of a broad-based economic recession certainly would be higher if the housing market were to weaken further.
The Key Indicators to Watch
To gauge whether the housing market is now at a stage that, in earlier decades, presaged housing downturns and recessions, I compare recent readings on four housing indicators with their trajectories near each of the three previous recessions. In particular, I examine:
- 30-year fixed mortgage rates
- Existing home sales
- Real house prices
- Contribution of residential investment to GDP growth
Each of these indicators is in a range that, in previous cycles, preceded a recession by a year or two.
1. 30-Year Fixed Mortgage Rates
Figure 1 shows quarterly movements in the 30-year fixed mortgage rate relative to its recent level, or more precisely, the 12 most recent quarters excluding the current one. Each recessionary episode is represented by roughly a six-year (25-quarter) line that is centered on the quarter in which a recession began: 1990:Q4, 2001:2Q and 2008:1Q. Figure 1 also displays the most recent experience under the assumption that the next recession will begin in 2019:Q4. I make this assumption simply to place the current cycle in a plausible position relative to previous cycles.
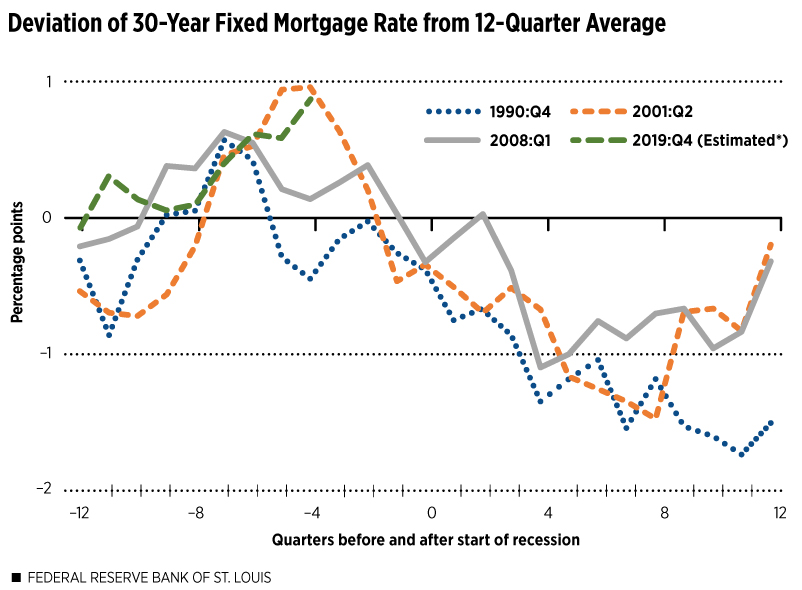
NOTES: The figure shows the average quarterly 30-year fixed mortgage rate minus the average of the previous three years (12 quarters). Each line shows three years of data before and after a recession; time zero is the quarter in which a recession began. The first quarter of the recession is indicated in the line label (key).
*This line assigns the beginning of the next recession (period zero) to the fourth quarter of 2019; of course, the onset of the next recession is unknown. The last observation in this series (for quarter -4) uses the Nov. 15 rate (4.94%) reported by Freddie Mac to represent the fourth quarter of 2018.
SOURCE: Freddie Mac.
As the figure shows, mortgage rates generally rise above their recent levels in the final years of an economic expansion. By the time a recession begins (quarter zero), mortgage rates already have declined below their recent levels. This decline continues for more than three years after the start of the recession.
Recent movements in the mortgage rate are consistent with this pattern seen in each of the three previous recessions. This does not mean that a recession is imminent in 2019:4Q, of course. But the recent trend line is consistent with this possibility.
2. Existing Home Sales
The cyclical pattern seen in 30-year fixed mortgage rates before and after the last three recessions is mirrored in the trend lines for existing single-family home sales. Figure 2 shows that home-sales activity was strong relative to recent levels for two to three years before the eventual recession, but then dropped toward or below its three-year trend line in the year or two just before the recession began. The cyclical momentum of home-sales activity reached its nadir near the onset of each of the previous three recessions. The current trajectory of existing home sales is consistent with this pattern, having recently fallen below its three-year average rate.
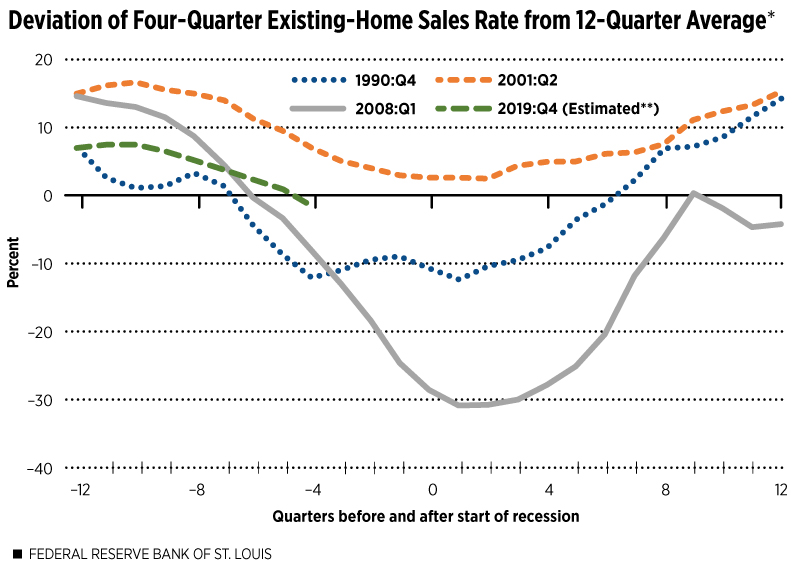
*The previous version of this chart inadvertently contained data errors. The chart has been amended, and the update does not affect the original analysis or conclusion.
NOTES: The figure shows the percent difference between the current rate of existing single-family home sales (four-quarter average) and the average annualized sales rate during the previous three years (12 quarters). Each line shows three years of data before and after a recession; time zero is the quarter in which a recession began. The first quarter of the recession is indicated in the line label (key).
**This line assigns the beginning of the next recession (period zero) to the fourth quarter of 2019; of course, the onset of the next recession is unknown. The last observation in this series (for quarter -5) is for the third quarter of 2018.
SOURCE: National Association of Realtors.
3. Real House Prices
Real, or inflation-adjusted, house-price changes varied widely during the three most recent business cycles. Figure 3 shows that the momentum in real house prices declined sharply two full years before the most recent recession began and stayed low for several quarters after. Cyclical weakness in real house prices did not appear until about six quarters before the 1990-91 recession began, and it never was as pronounced as during the Great Recession. Real house prices were even steadier before and after the 2001 recession. The recent behavior of real house prices is well within this broad range of historical experience, resembling the 1990-91 and 2001 experiences more closely than the 2008-09 experience.
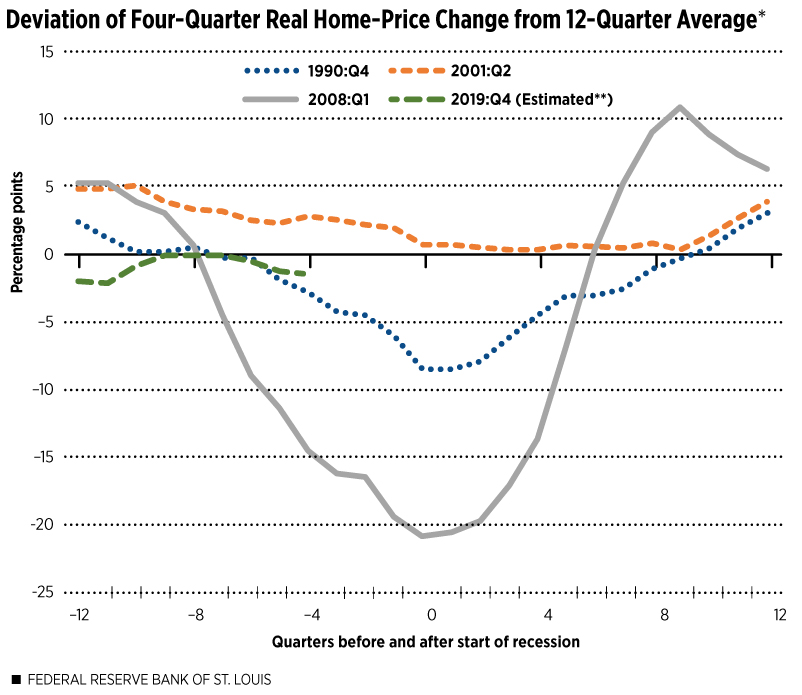
*The previous version of this chart inadvertently contained data errors. The chart has been amended, and the update does not affect the original analysis or conclusion.
NOTES: The figure shows the four-quarter percent change in the CoreLogic Home Price Index, deflated by the Personal Consumption Expenditures (PCE) Chain-Weighted Price Index, minus the annualized percent change during the previous three years (12 quarters). Each line shows three years of data before and after a recession; time zero is the quarter in which a recession began. The first quarter of the recession is indicated in the line label (key).
**This line assigns the beginning of the next recession (period zero) to the fourth quarter of 2019; of course, the onset of the next recession is unknown. The last observation in this series (for quarter -5) is for the third quarter of 2018.
SOURCES: S&P CoreLogic and U.S. Bureau of Economic Analysis.
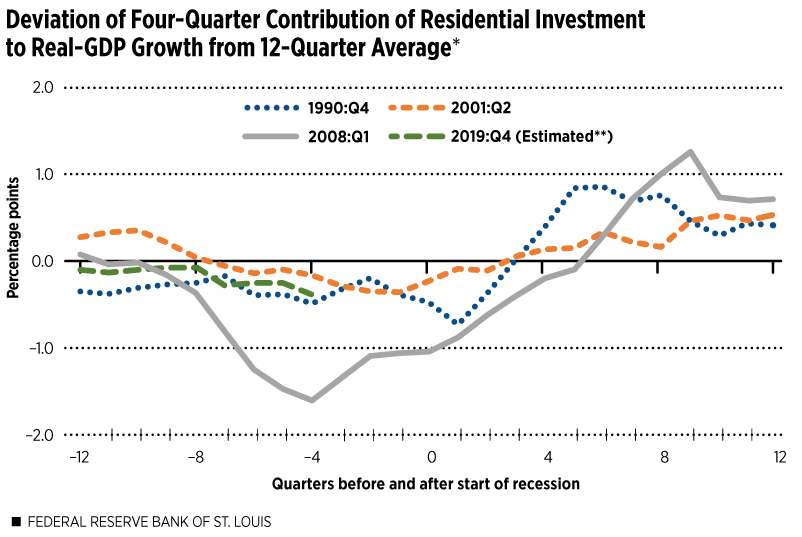
4. Contribution of Residential Investment to GDP Growth
The contribution that residential investment makes to overall economic growth represents the most direct link between housing cycles and business cycles. This measure is broader than housing starts because it also includes investment in home improvements while reflecting total dollar amounts, not just the number of units.
The Great Recession period again stands out as a particularly severe housing downturn. Housing investment also clearly lost momentum well before the 1990-91 and 2001 recessions. Assuming that a recession begins in the fourth quarter of 2019, by no means certain, the current path of residential investment will have followed a very similar path to those seen in both the 1990-91 and 2001 downturns. In every case shown here, residential investment was losing momentum for more than a year before the recession began.
*The previous version of this chart inadvertently contained data errors. The chart has been amended, and the update does not affect the original analysis or conclusion.
NOTES: The figure shows the four-quarter average contribution to real GDP growth minus the annualized contribution during the previous three years (12 quarters). Each line shows three years of data before and after a recession; time zero is the quarter in which a recession began. The first quarter of the recession is indicated in the line label (key).
**This line assigns the beginning of the next recession (period zero) to the fourth quarter of 2019; of course, the onset of the next recession is unknown. The last observation in this series (for quarter -5) is for the third quarter of 2018.
SOURCE: U.S. Bureau of Economic Analysis.
Not All Housing Indicators Point to a Slowdown, But Watch the Ones that Do
It is not difficult to find housing-related indicators that are less gloomy. For example, employment in residential construction increased by 7.1 percent in the year ending the third quarter of 2018.U.S. Bureau of Labor Statistics. See https://fred.stlouisfed.org/series/CES2023610001. Comparable growth rates exactly one year before each of the three previous recessions were much lower—at -4.3 percent, 4.8 percent and -3.5 percent, respectively—and were plunging by the time the recessions started. This suggests that this indicator is quite volatile around turning points. Still, today’s rapid growth in residential construction employment does not necessarily mean that a housing downturn will be avoided.
Another observation to keep in mind is that the degree of advance warning from any particular signal has varied substantially, as the figures reveal. All four indicators have also generated false alarms—instances of housing weakness that were not followed by a recession within the next few years.
Despite these caveats, it’s noteworthy that several indicators of housing-sector momentum currently line up reasonably well with patterns seen before the past three recessions. This is no guarantee that a recession will begin within the next year or two, but evidence suggests that housing-related indicators warrant careful monitoring.
Endnotes
- See Leamer, Edward E. “Housing Is the Business Cycle.” Economic Policy Symposium Proceedings: Housing, Housing Finance, and Monetary Policy, Federal Reserve Bank of Kansas City, August 2007, pp. 149-233.
- In this analysis, we designate the start of the Great Recession as the first quarter of 2008, since it was the first full quarter of recession.
- U.S. Bureau of Labor Statistics. See https://fred.stlouisfed.org/series/CES2023610001.
This article originally appeared in our Housing Market Perspectives publication.

This blog offers commentary, analysis and data from our economists and experts. Views expressed are not necessarily those of the St. Louis Fed or Federal Reserve System.
Email Us
All other blog-related questions
