

All Low- and Moderate-Income Areas Are Not Created Equal
Stark disparities in consumer credit exist in low- and-moderate-income (LMI) neighborhoods across metropolitan areas (MSAs). Consider George, who lives in Montgomery, Ala., and Francine, who lives in Madison, Wis. Both individuals live in an LMI neighborhood, which is defined as an area where the median income is 80 percent of the average median income in the metro area or state. Each is looking to purchase a car, both to reduce their commute time to work and to allow them more options for child care for their young children. Like many in his neighborhood, George has poor credit and, as a result, is not able to secure financing from a financial institution to buy a car. However, Francine is part of the vast majority of people in her neighborhood who have good credit and, consequently, she has no trouble securing a car loan from a bank.
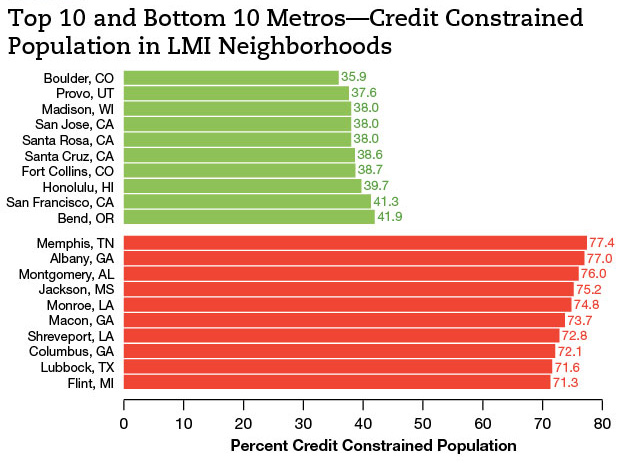
The example above is played out across 200-plus MSAs for which data is available. Boulder, Colo., is on one end of the spectrum, with 35.9 percent of the population in LMI neighborhoods credit constrained, defined as having poor/fair or no credit history. On the other end is Memphis, Tenn., where 77.4 percent of the population in LMI neighborhoods (nearly eight out of every 10 people) are credit constrained. (See Figure 1.) This disparity has big implications for both the residents of these neighborhoods and the regulated financial institutions that serve these markets, which have certain obligations under the Community Reinvestment Act (CRA). Before describing the implications of this disparity, it’s worth noting some observations.
FIGURE 1
Observations
LMI neighborhoods comprised of residents with relatively better credit tend to have a larger percentage of white occupants; they are usually located in the East, West and parts of the upper Midwest, and they tend to have relatively low poverty rates.
LMI neighborhoods comprised of residents with poor credit tend to have a larger share of African-American occupants; they are usually located in the South and they tend to have relatively high poverty rates. In fact, among the ten MSAs in which people living in LMI neighborhoods have the poorest credit, the average poverty rate is 68 percent higher than the average poverty rate of the ten MSAs where people living in LMI neighborhoods have the best credit.1 Jackson, Miss., Shreveport, La., and Montgomery, Ala., are examples of this demographic.
Interestingly, there are MSAs that are clear outliers based on their geographic peers. For instance, the LMI neighborhoods of Madison, Wis., Ann Arbor, Mich., Charlottesville, Va., and Houma, La., are all overperforming their peers. In other words, there is a substantially smaller portion of the population who are credit constrained and living in an LMI neighborhood than their peers in the surrounding MSAs. Coincidentally, three of these four MSAs have universities located within their borders and are what some consider a “college town.”
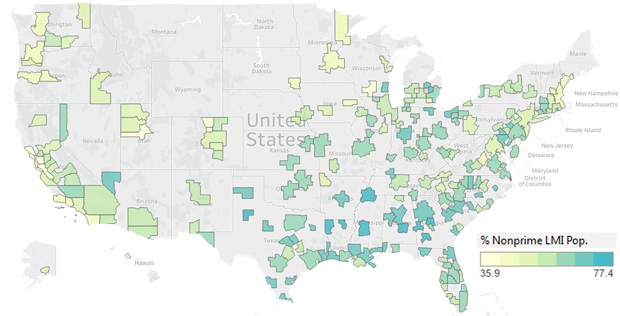
Conversely, the LMI neighborhoods of Reno, Nev., Milwaukee, Yakima, Wash., and Bakersfield, Calif., all are underperforming their geographic peers. (See Figure 2.)
FIGURE 2
Credit Constrained Population of LMI Areas
Implications
As has been illustrated, the credit profiles of people living in LMI neighborhoods across the country vary significantly. Why should that matter? There are at least two groups for whom it matters a great deal.
A good credit profile can be the make-or-break detail that determines an individual’s ability to get a mortgage, car loan or student loan. It can also be a factor in whether or not one can rent an apartment, how much insurance costs, and securing employment. In short, good credit can signify whether an individual’s financial situation is on the right track. This can be particularly powerful for someone living in an LMI neighborhood where opportunities to improve their situation can be scarce and hope can feel far off in the distance. That’s why many nonprofit organizations throughout the country, sometimes in partnership with bank representatives, work with people to improve their credit profiles. And it’s why some community-based organizations (e.g., Justine Petersen, headquartered in St. Louis) view credit as an asset.
Regulated financial institutions, depending on size, are required to comply with the CRA and, therefore, to meet varying thresholds relative to investments, loans and service in LMI neighborhoods. Currently, the credit profile of a bank’s assessment area, which may include part of or an entire MSA, is not taken into consideration when determining whether a bank is meeting its obligation under the CRA. But maybe it should be. As the data illustrates, a bank operating in Madison will have a much easier time finding qualified borrowers in LMI neighborhoods than a bank in Memphis, Tenn. On a per capita basis, a bank operating in both metro areas will have to work twice as hard to find a qualified borrower in Memphis. This raises some important questions about the appropriate role of the CRA in promoting fair and impartial access to credit in underserved communities, such as:
- Should additional weight be given to loans and investments made in LMI areas where more people are credit constrained?
- How can the service test better encourage activities associated with credit building in LMI areas where more people are credit constrained?
- Are there other measures, such as the poverty rate, that can complement area median income to determine targeted populations?
For the first time, consumer credit data for LMI areas in 200-plus MSAs is publicly available via the Consumer Credit Explorer, thanks to Equifax and the Federal Reserve banks of Minneapolis, New York and Philadelphia. Through the release of this data, researchers will be able to better understand the factors that determine why people in some LMI neighborhoods of one MSA can have drastically different credit profiles than people in LMI neighborhoods of other MSAs. Until that is sorted out, residents like Francine, living in LMI neighborhoods in MSAs such as Madison, Boulder and San Jose, will have a much better shot at accessing credit—and thus opportunity—than those like George who live in LMI neighborhoods in MSAs such as Montgomery, Memphis and Jackson.
Data: FRBNY Consumer Credit Panel/Equifax Data (12/1/2015), tabulated by the Federal Reserve Banks of Philadelphia and Minneapolis and accessed via the Consumer Credit Explorer
Mike Eggleston is a senior community development specialist at the Federal Reserve Bank of St. Louis.
Endnotes
- Census Bureau, American Community Survey, 2014 1-year Estimates. [ back to text ]

Bridges is a regular review of regional community and economic development issues. Views expressed are not necessarily those of the St. Louis Fed or Federal Reserve System.
Email Us
All other community development questions
