

Just How Severe Is America’s Racial Wealth Gap?

Estimates of the U.S. racial wealth gap differ widely. We explain why that is.
Recently there has been an increased focus on racial financial inequality—in particular, the racial wealth gap.
We at the Center for Household Financial Stability have written extensively on this subject, including a recent blog post providing basic facts and figures concerning wealth inequality across a variety of demographics.
One undeniable finding is that wealth differs greatly by a household’s self-reported race or ethnicity. Estimates of the wealth gap, however, differ widely by source.
What can reconcile these differences, and just how severe is the true racial wealth gap in America?
Here are the more conventional and inclusive racial wealth gap estimates.
First, some definitions. Household wealth, or net worth, is the difference between:
- Total assets (e.g. a savings account, a house, a 401[k], or your car); and
- Total liabilities (e.g. credit card debt, student loans, a mortgage, car loans)
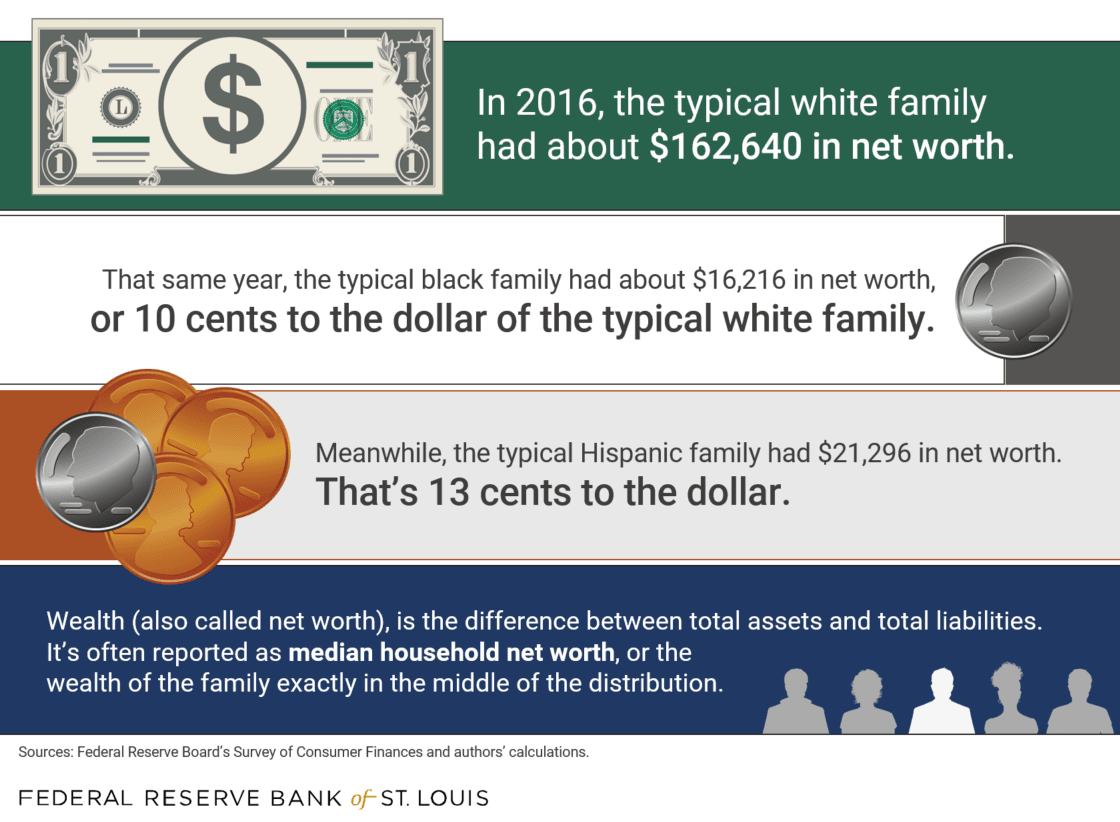
Gaps are often measured by the wealth ratio between white families and black or Hispanic families. Wealth is typically reported as median household net worth, or the wealth of the family exactly in the middle of the distribution. Using the median gives a sense of how the “typical” family is doing and is less sensitive to the extremely high wealth holdings at the top of the distribution.
Looking at median household wealth by race/ethnicity, we find that the more conventional and inclusive white-black wealth gap is 10 to 1, and the white-Hispanic wealth gap is 7.6 to 1.
In 2016, the typical white family had around $162,640 in net worth. In contrast, the typical black family and typical Hispanic family had about $16,216 and $21,296, respectively.
By flipping the ratio, we can put the gap in perhaps more familiar terms: the typical black family had 10 cents to the dollar of the typical white family, and the typical Hispanic family had around 13 cents to the dollar.
What America’s racial wealth gap looks like, in dollars and cents:
Others use different methods to calculate the ratio of wealth inequality.
While these gaps are disturbing, they might be lower than other estimates you may have come across. But how can that be possible? Isn’t there a consensus on how to measure these gaps?
Not quite.
There are alternative approaches that remove the value of certain types of assets from household net worth. Specifically, some researchers remove the value of a household’s vehicle(s) and that of other “durable” goods (think furniture or appliances). These assets tend to encompass a greater share of total assets among black and Hispanic families in the middle of the wealth distribution.
Therefore, removing the value of vehicle(s) and other durable goods inflates the racial wealth gap by a considerable amount.
Using this approach, the typical white household in 2016 had $139,790, while the typical black and Hispanic households had $3,770 and $6,110, respectively. Thus, the white-black wealth gap rises to 37.1 to 1, and the white-Hispanic wealth gap rises to 22.9 to 1.
As shocking as those numbers are, it’s doubtful that removing these assets is a fair accounting of household net worth. After all, a car is a crucial asset for any family and provides transportation; often, a household’s earnings rely on that transportation. While not as liquid as cash or a savings account, a car can be used to raise cash by selling it or pledging it in a car-title loan.
Also, a loan associated with a car often isn’t removed from net worth, and this too exacerbates the racial wealth gap. If the loan is also omitted, the white-black wealth gap falls to 19.5 to 1, and the white-Hispanic wealth gap falls to 16.1 to 1.
Clearly, all of these gaps remain substantial, and their differences highlight how sensitive our understanding of wealth gaps are to what exactly is included as an asset or liability.
The size of the racial wealth gap is sensitive to what's included in wealth:
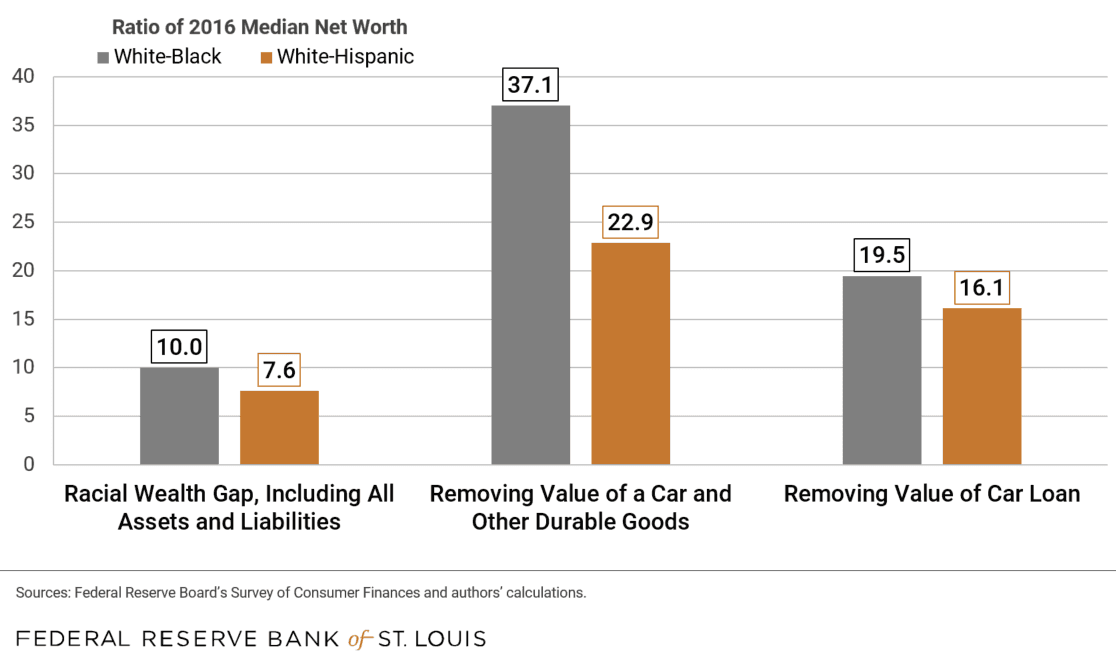
Description: This bar chart shows the racial wealth gap in 2016 as measured by the ratio of median net worth among white families over the median net worth of black and Hispanic families. This ratio is 10 and 7.6 for the white-black and white-Hispanic wealth gaps, respectively. After removing the value of vehicles (such as a car) and other durable goods (such as furniture) from net worth, the white-black and white-Hispanic ratios increase to 37.1 and 22.9, respectively. Also removing the value of liabilities associated with vehicles lowers the white-black and white-Hispanic ratios to 19.5 and 16.1, respectively.
To close the racial wealth gap, it’s vital to know how severe it is.
What is clear is that the racial wealth gap is complex and has been relatively unchanged for decades. Our research has also found that it persists even at the highest levels of education.
Based on our work, the racial wealth gaps observed today appear to have deep historical roots and persist, in part, due to structural and systemic barriers.
Closing these gaps will be no easy task, but understanding just how much of a gap needs to be closed is an important starting point.
Additional Resources


This blog explains everyday economics, consumer topics and the Fed. It also spotlights the people and programs that make the St. Louis Fed central to America’s economy. Views expressed are not necessarily those of the St. Louis Fed or Federal Reserve System.
Email Us
