

Millennials Are Catching Up in Terms of Generational Wealth

©guvendemir/iStock/Getty Images Plus
By Ana Hernández Kent, Senior Researcher, Institute for Economic Equity; and Lowell R. Ricketts, Data Scientist, Institute for Economic Equity
In 2018, we published an essay in our Demographics of Wealth series in which we explored the impact of the Great Recession on young families. Our results showed that families headed by those born in the 1980sFor simplicity, we group families into decadal groups according to the birth year of the survey respondent. We refer to those born between 1980 and 1989 as older millennials. (referred to as “older millennials,” the youngest group we analyzed at the time) were about 34% below wealth expectations. (By “wealth expectations,” we mean a predicted level based on the wealth held by families in that generation and earlier generations at similar ages.) This led us to ponder whether older millennials would become part of an economically “lost generation.”
Today, armed with new data and a new methodology, we revisited our question. It turns out that millennials may not be as “lost” as we once thought. (Note that our data do not capture the effects of the COVID-19 recession, which could erode some of these gains.)
Older Millennials Made Gains but Remain Off Course
We used 11 survey waves (1989-2019) from the Survey of Consumer Finances (SCF) to calculate an estimated life cycle of wealth. By a life cycle, we mean the general path that wealth accumulation tends to follow: Young families start out with low levels of wealth and may need to borrow, then they accumulate savings and pay down debts as they reach their mid-adult years, and finally these families begin to draw on this wealth in retirement. While this isn’t the experience of all families, the typical family tends to follow that trajectory.
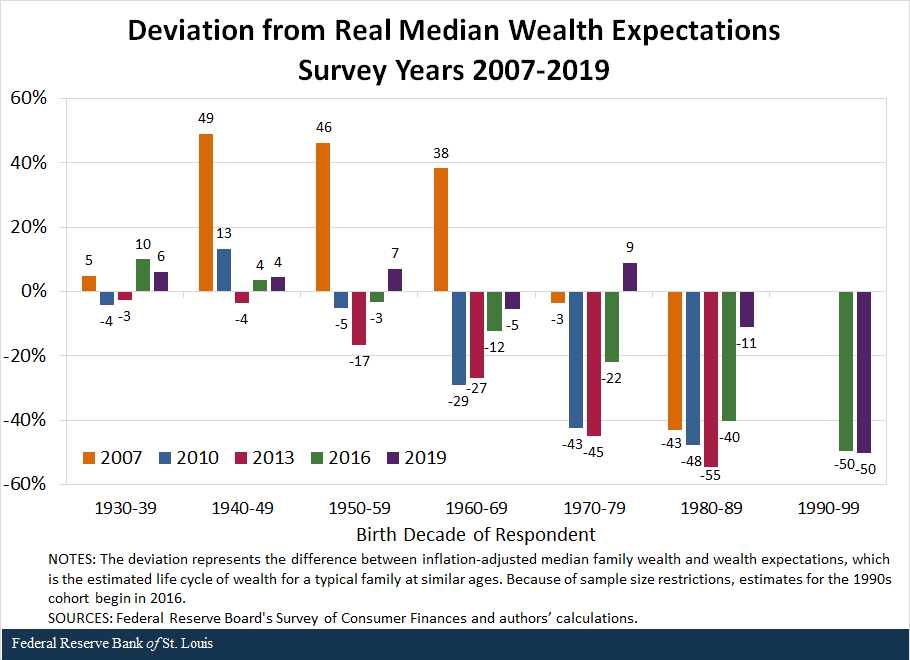
This trajectory tells us how much wealth we would expect a typical family to have at each age.For a more detailed explanation of our method, see Sidebar 2 in The Demographics of Wealth: A Lost Generation? Long-Lasting Wealth Impacts of the Great Recession on Young Families. We are then able to compare real median wealth levels for different groups with these expectations. In our study, we grouped families by the decade in which their survey respondent was born.In past work, we have used the birth year of the head (i.e., reference person) of the household. Here, we change our methodology and use the birth year of the survey respondent, who is generally considered to be the most financially knowledgeable person in a household. In many (though not all) cases, the reference person and respondent are the same. Previous results are roughly comparable with the results presented here. We focused on families with respondents born in each decade from the 1930s through the 1990s (younger millennials, older Gen Z).
From 2016 to 2019, families with respondents born between 1940 and 1989 all gained ground in relation to wealth expectations. (See the figure below.) While older millennials (those born in the 1980s) were still 11% below wealth expectations, this represented significant progress from a 40% deficit in 2016.Because of the updated methodology (see Endnote 2), estimates in this article will vary slightly from those in past essays. Those born in the 1960s were also slightly below wealth expectations, while the 1990s cohort showed a significant deficit of 50% (though that group was still quite young, with an average age of 25 in 2019).
Growing Wealth Gap between Younger and Older Families
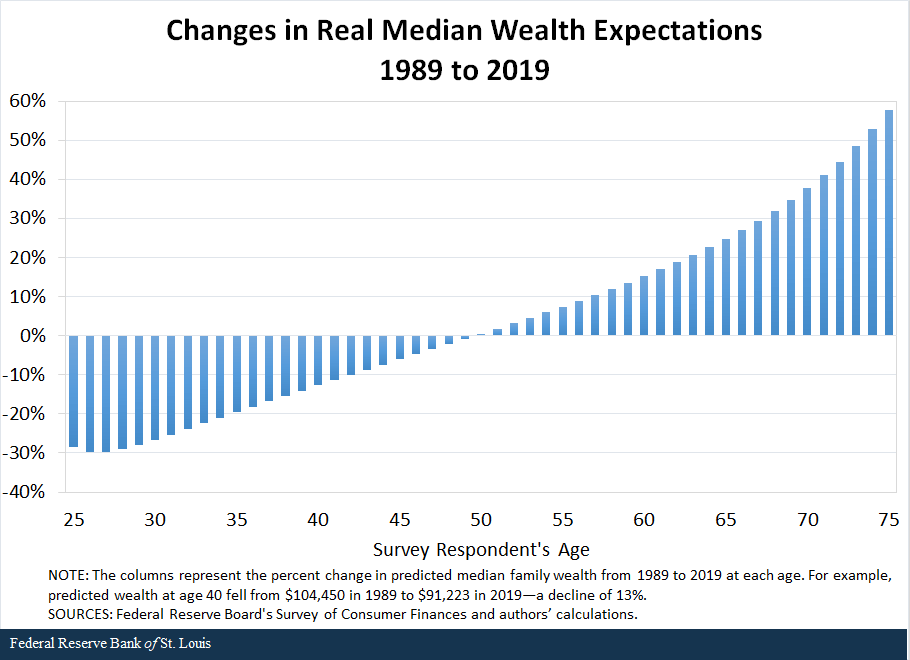
We again found a long-run divergence of wealth accumulation between younger and older families. As mentioned earlier, older families typically have more wealth than younger families, outlined as the life cycle.
However, we also found that older families (age 50 and older) in 2019 were also wealthier than their peers of similar ages 30 years earlier, even after adjusting for inflation. Conversely, younger families in 2019 appeared to be less wealthy than their peers of similar ages in the past, as shown in the figure below.The figure shows wealth expectations, which are derived from a function that is fitted to the inflation-adjusted median wealth values of families across the age distribution in those years. This suggests that the period in which one is born influences wealth accumulation beyond one’s age.
Reasons for Optimism
As the first figure shows, older millennials and 1970s-born Gen Xers saw significant gains in real median wealth from 2016 to 2019 (29 and 31 percentage points, respectively). Even though families of younger millennials (born between 1990 and 1996) and older Generation Z (born between 1997 and 1999) were behind, they also have time to gain lost ground; for example, from 2016 to 2019, older millennials and Gen Xers staged a remarkable comeback.
Keep in mind that the 1990s cohort is also set to become a highly educated generation. Therefore, it is possible that younger generations will simply have a steeper wealth life cycle than older generations (which make up the majority of our sample) and will eventually make up the difference.
Despite high prices for entry-level homes and financial obligations such as student loans, the share of millennials and Gen Zers who have become homeowners is similar to that of previous generations when they were the same ages. Because home equity (the value of the home less the mortgage debt) is an important source of wealth for many families, comparable rates of ownership for these younger generations give hope that these families can accumulate wealth faster and make up the shortfalls we currently observe.
Reasons for Pessimism
Though older millennials have made great advances recently, their median wealth was still 11% below expectations. Given that the oldest among them are entering their 40s, there is less time to catch up and take advantage of wealth-building avenues.
Additionally, older millennials had more debt as a share of income than we would have expected. In fact, they had the highest debt burden of any birth group in 2019, which makes them particularly vulnerable to economic setbacks.
Finally, it is important to remember that the latest data from the SCF do not capture the effects of the COVID-19 recession.The Real State of Family Wealth report, which is updated quarterly, monitors how generational wealth is affected on average. Given wealth inequality, however, averages tend to reflect families who are better off than the typical American household. (See the appendix of an earlier blog post for more information.) Because the next wave of the Survey of Consumer Finances will be in 2022, it may be some time before we are able to fully understand the impact of the COVID-19 recession on families’ wealth. This event could be a major headwind for millennials, particularly for those who have suffered disproportionate job or income loss. In our next post, we explore wealth outcomes for subgroups of millennials to better understand which demographic groups are more at risk of falling and staying behind.
Notes and References
- For simplicity, we group families into decadal groups according to the birth year of the survey respondent. We refer to those born between 1980 and 1989 as older millennials.
- For a more detailed explanation of our method, see Sidebar 2 in The Demographics of Wealth: A Lost Generation? Long-Lasting Wealth Impacts of the Great Recession on Young Families.
- In past work, we have used the birth year of the head (i.e., reference person) of the household. Here, we change our methodology and use the birth year of the survey respondent, who is generally considered to be the most financially knowledgeable person in a household. In many (though not all) cases, the reference person and respondent are the same. Previous results are roughly comparable with the results presented here.
- Because of the updated methodology (see Endnote 2), estimates in this article will vary slightly from those in past essays.
- The figure shows wealth expectations, which are derived from a function that is fitted to the inflation-adjusted median wealth values of families across the age distribution in those years.
- The Real State of Family Wealth report, which is updated quarterly, monitors how generational wealth is affected on average. Given wealth inequality, however, averages tend to reflect families who are better off than the typical American household. (See the appendix of an earlier blog post for more information.) Because the next wave of the Survey of Consumer Finances will be in 2022, it may be some time before we are able to fully understand the impact of the COVID-19 recession on families’ wealth.
Additional Resources
This blog offers commentary, analysis and data from our economists and experts. Views expressed are not necessarily those of the St. Louis Fed or Federal Reserve System.
Email Us
All other blog-related questions
