

COVID-19 and the Importance of Testing
By now, everyone might be familiar with the words uttered during a White House Press Briefing on Feb 26, 2020: “...when you have 15 people, and the 15 within a couple of days is going to be down to close to zero...” “Remarks by President Trump, Vice President Pence, and Members of the Coronavirus Task Force in Press Conference,” Press Conference, Feb. 26, 2020.
In this post, we make the point that using only the number of confirmed COVID-19 cases does not help us understand the scope of the pandemic. Without also using the data on tests, it is difficult to diagnose the problem. (As an extreme example, the number of confirmed cases would be zero if we did not test anyone!)
The figure below shows COVID-19-related deaths per 10 million people for two countries: South Korea and China.
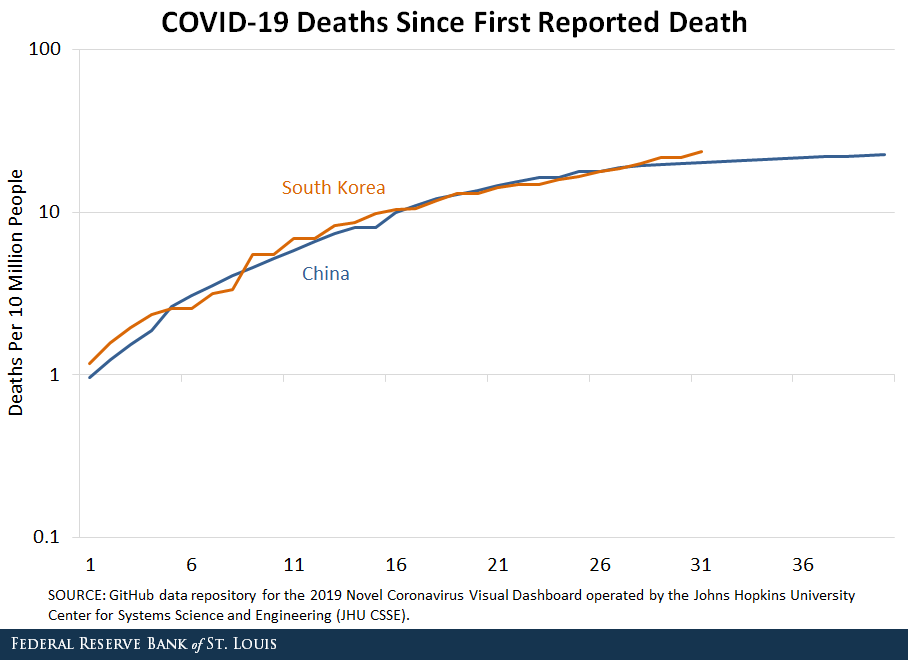
Starting from the first death due to COVID-19 in each country, the pattern of deaths has been remarkably similar. Scaled by population, the number of deaths in the two countries has been roughly the same. Total number of deaths in China as of March 23, is 3,274. With a population of almost 1.4 billion, the number of deaths in China is 24 per 10 million people. For South Korea, the number of deaths is 111. With a population of 51 million, the number of deaths is 22 per 10 million people.
However, as a fraction of confirmed cases, the pattern is different between the two countries. The number of deaths in China amounts to 4% of confirmed cases, while it amounts to 1.2% in South Korea.
Why are the two numbers different? To understand this, consider the following accounting:
DP = DC x CT x TI x IP
- DP = Deaths / Population
- DC = Deaths / Confirmed Cases
- CT = Confirmed Cases / Tests
- TI = Tests / Infected Cases
- IP = Infected Cases / Population
The number of infected cases is unknown since everyone could be a potential carrier of the virus without exhibiting any symptoms. Assume for the moment that the last ratio on the right-hand side (IP) is the same in both countries, which is plausible since the pandemic seems to have stabilized in both countries. The ratio on the left-hand side (DP) is the same in China and South Korea, as per the figure above. Then, the product of DC x CT x TI must be the same in China and South Korea.
As noted before, the ratio of deaths to confirmed cases (DC) in China is 0.04 and in South Korea is 0.012. As of a month ago (Feb. 24), the ratio of confirmed cases to tests (CT) was 0.02 for China and 0.029 for South Korea.For China, the test data are available only as of Feb. 24 and only for the Guangdong province. The number of confirmed cases is available for the entire country. The ratio CT is derived by taking the number of confirmed cases per million in China and dividing it by the number of tests per million in Guangdong, the assumption being the testing rate for the Guangdong province (population of more than 113 million) is a good proxy for the entire country.
0.04 x 0.02 x TI(China) = 0.012 x 0.029 x TI(South Korea)
Therefore, the ratio of tests to infected cases (TI) for South Korea is 2.3 times that for China. Thus, despite the large difference in the deaths-to-confirmed-cases ratio, the identical death-to-population ratio in China and South Korea can be attributed to differences in testing. The mortality for confirmed cases of COVID-19 is not sufficient to deduce the mortality in the population, because testing could make a big difference.
Notes and References
1 “Remarks by President Trump, Vice President Pence, and Members of the Coronavirus Task Force in Press Conference,” Press Conference, Feb. 26, 2020.
2 Scaled by population, the number of deaths in the two countries has been roughly the same. Total number of deaths in China as of March 23, is 3,274. With a population of almost 1.4 billion, the number of deaths in China is 24 per 10 million people. For South Korea, the number of deaths is 111. With a population of 51 million, the number of deaths is 22 per 10 million people.
3 For China, the test data are available only as of Feb. 24 and only for the Guangdong province. The number of confirmed cases is available for the entire country. The ratio CT is derived by taking the number of confirmed cases per million in China and dividing it by the number of tests per million in Guangdong, the assumption being the testing rate for the Guangdong province (population of more than 113 million) is a good proxy for the entire country.
Additional Resources


This blog offers commentary, analysis and data from our economists and experts. Views expressed are not necessarily those of the St. Louis Fed or Federal Reserve System.
Email Us
All other blog-related questions
