

Fed Policies' Continued Effects on Short-Term Liquidity Markets

The Federal Reserve implemented a number of policies to combat the effects of the 2007-08 financial crisis and the recession that followed. Three of these are notable for their persistent impact on short-term liquidity markets:
- Keeping interest rates low
- Paying interest on banks’ reserve balances
- Buying securities on a large scale
The Federal Funds Rate
First, the target for the federal funds rate (FFR), which largely determines other market short-term rates, was set near zero from December 2008 until “liftoff” in December 2015. As of September, the target range for the FFR was set at 2 to 2.25 percent annual, which is still considered low by historical standards. The figure below shows the effective FFR, which falls within the target range set by the Fed.
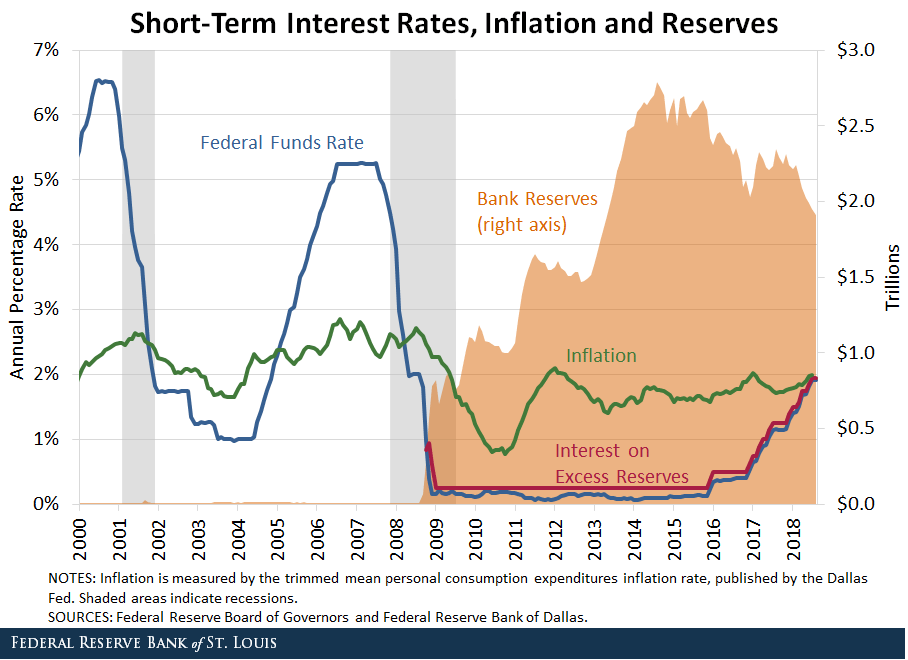
Interest on Excess Reserves
Second, the Fed began paying interest on banks’ reserve balances in October 2008. (The Federal Reserve Act had to be amended to allow this.) The interest on excess reserves (IOER) was 1.98 percent annual in September.
In theory, the IOER should work as a floor on overnight interest rates, since no bank would lend reserves to other institutions at a rate lower than what it can get from the Fed. See Williamson, Stephen D. “Interest Rate Control Is More Complicated Than You Thought,” The Regional Economist, April 2016, Vol. 24, Issue 2, pp. 15-17; and Williamson, Stephen D. “Monetary Policy Normalization in the United States,” Federal Reserve Bank of St. Louis Review, Second Quarter 2015, Vol. 97, Issue 2, pp. 87-108.
IOER and the FFR
As the figure shows, the IOER has systematically been above the effective FFR. This means that some institutions with excess liquidity that participate in the federal funds market were not earning at least the IOER.
One reason is that not all institutions participating in the federal funds market have a deposit account at the Fed. Chiefly among these institutions are government-sponsored enterprises (GSEs).
To provide an effective floor, the Fed opened an overnight reverse-repo facility, which allowed a broad set of financial institutions to earn a minimum rate by lending funds to the Fed. The rate on reverse repos with Treasuries has been set at or very close to the lower bound on the target range for the FFR.
Other Short-Term Interest Rates
Perhaps more surprisingly, the IOER has been the effective ceiling of other short-term interest rates. The figure below compares the IOER with overnight rates on deposits and repos.
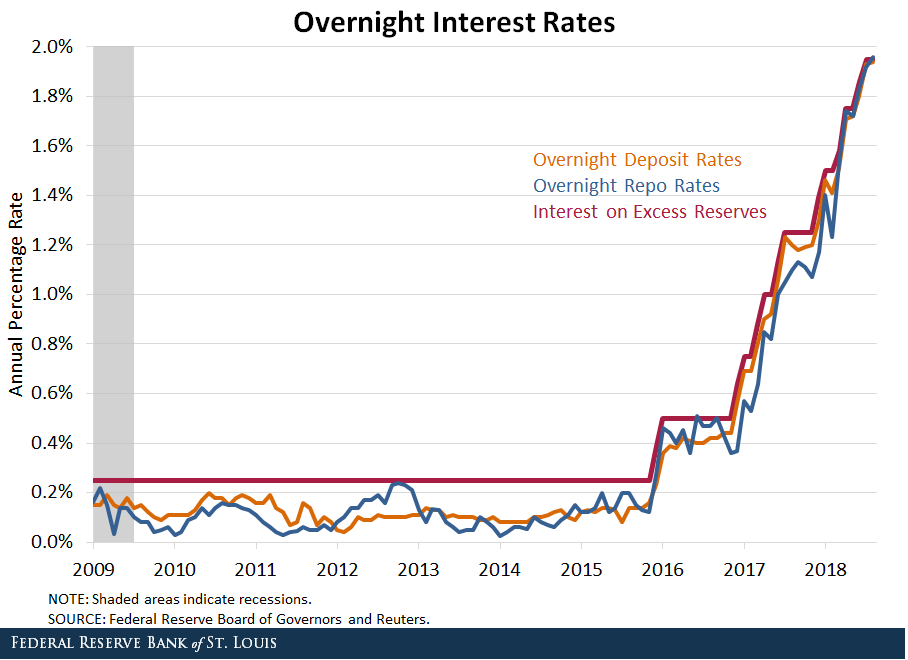
As we can see, the IOER has mostly remained above these two rates, implying that (at least some) banks have been able to borrow funds overnight, deposit them at the Fed and earn a spread, in essence engaging in carry trade in liquidity markets.
Market power, balance sheet costs and other frictions are likely contributors to the fact that this spread was not arbitraged out. Note, however, that with higher interest rates, the spread between the IOER and these two overnight rates has disappeared.
Another interesting related fact is that, until late 2017, the IOER also exceeded the rates on longer-term securities such as three-month Treasury bills. From roughly mid-2011 to mid-2015, even yields on one-year Treasury securities were below the IOER. Part of the reason in this case may have been the relative shortage of these securities in liquidity markets.
Quantitative Easing
Third, to affect longer-term interest rates in a world with near-zero short-term rates, the Fed embarked on large-scale asset purchases (i.e., quantitative easing, or QE). These programs consisted of purchases of Treasuries and agency- and GSE-backed securities.
As a result, the Fed’s total assets went from slightly below $1 trillion by the end of 2007 to an average of $4.5 trillion in 2017. Currently, the Fed is gradually shrinking its balance sheet by not replenishing maturing assets (up to a monthly limit).
Increase in Bank Reserves
A byproduct of IOER and QE has been the dramatic increase in the stock of bank reserves. These were about $8 billion (or $0.008 trillion) in December 2007, reached a peak of $2.8 trillion in mid-2014 and were $1.9 trillion in August 2018.
The figure below shows the asset composition of private depository institutions.
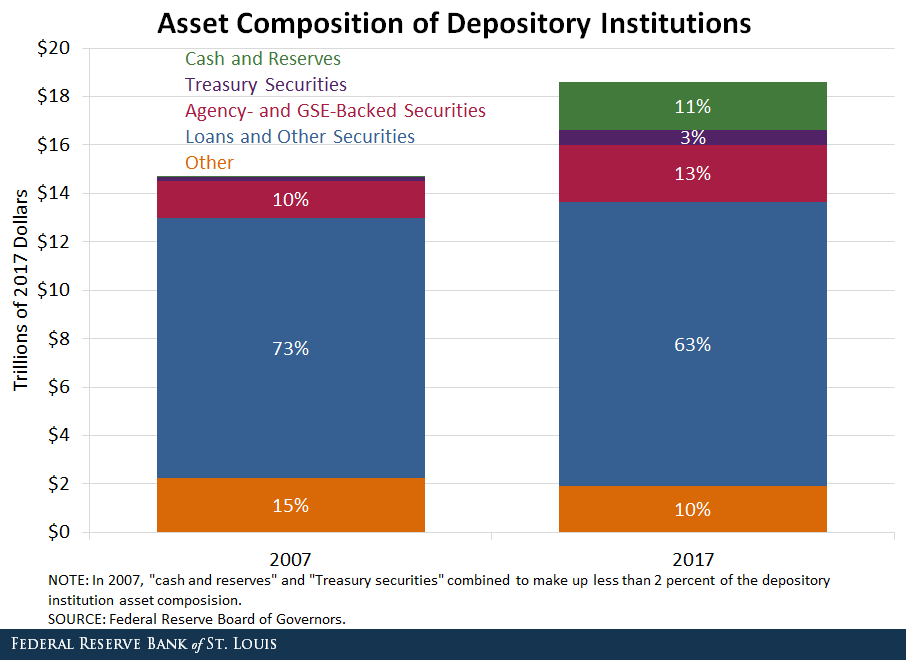
Comparing 2007 and 2017, we can see that overall, banks have substituted loans and securities (other than Treasuries and agency- and GSE-backed) for reserves. Required reserves are relatively tiny, so what else explains the demand for reserves by banks? Three potential reasons come to mind:
- Prudential, due to perceived elevated risk since the financial crisis and recession
- Regulatory, due to new requirements, such as liquidity coverage ratios and resolution planning
- Speculative, due to the possibility of engaging in carry trade in liquidity markets
As the final figure shows, roughly 35-40 percent of all reserves are held by foreign-related institutions (essentially, U.S. branches of foreign banks).
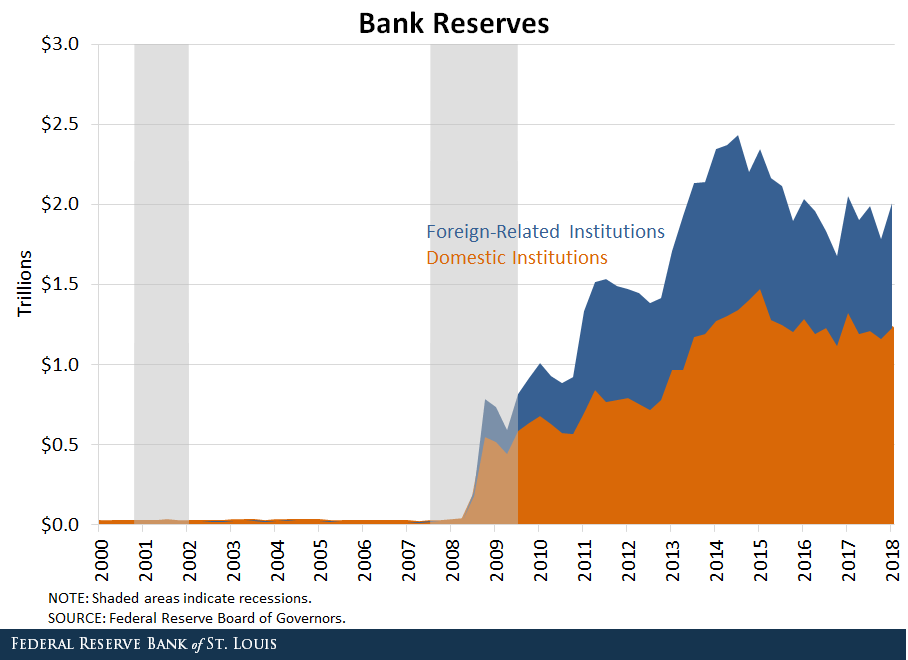
These institutions are generally small and collectively account for less than 10 percent of all deposits. Therefore, prudential and regulatory reasons are unlikely to explain their demand for reserves.
This leaves a speculative motive as a likely explanation. Basically, these banks can borrow at cheap rates abroad (say, in euros or Swiss francs) and deposit at the Fed (in U.S. dollars). This practice is not riskless as foreign exchange rates fluctuate, sometimes unpredictably.
Looking Ahead
As short-term interest rates continue to rise and the Fed’s balance sheet continues to shrink, a few relevant questions emerge:
- How will the spread of the IOER and other short-term rates evolve as rates go up?
- How will the FFR react to a shrinking Fed balance sheet?
- What is the Fed balance sheet’s optimal size?
In part, the answers will come from further understanding banks’ demand for reserves.
Notes and References
1 See Williamson, Stephen D. “Interest Rate Control Is More Complicated Than You Thought,” The Regional Economist, April 2016, Vol. 24, Issue 2, pp. 15-17; and Williamson, Stephen D. “Monetary Policy Normalization in the United States,” Federal Reserve Bank of St. Louis Review, Second Quarter 2015, Vol. 97, Issue 2, pp. 87-108.
2 The rate on reverse repos with Treasuries has been set at or very close to the lower bound on the target range for the FFR.
3 From roughly mid-2011 to mid-2015, even yields on one-year Treasury securities were below the IOER.
Additional Resources
- On the Economy: GDP, Labor Force Participation and Economic Growth
- Regional Economist: Interest Rate Control Is More Complicated Than You Thought
- Review: Monetary Policy Normalization in the United States

This blog offers commentary, analysis and data from our economists and experts. Views expressed are not necessarily those of the St. Louis Fed or Federal Reserve System.
Email Us
All other blog-related questions
