

Loan Quality In The Eighth District: Worth A Closer Look
The U.S. banking industry enjoyed a banner year in 1995, posting record earnings of $48.7 billion. Some banking analysts worry, however, that developing loan quality problems, particularly in the consumer area, may threaten this robust profitability. Loan quality essentially refers to the likelihood that a bank will be repaid the money it disperses on a given loan. Poor loan quality lowers profitability for banks because they charge expected loan losses against earnings.
For their part, District banks posted record earnings of $2.2 billion in 1995. At the same time, however, the level of nonperforming loans—those that are at least 90 days past due or are not accruing interest—rose sharply. Does this increase in nonperforming loans foreshadow a loan quality problem of sufficient magnitude to torpedo District profitability? The answer requires a careful look at the evidence.
Loan Quality Dips
At first glance, the sharp increase in nonperforming loans appears worrisome. District-wide, nonperforming loans leapt by 30.4 percent last year. This jump compares with a 1.8 percent increase in nonperforming loans at peer banks—U.S. banks with less than $15 billion in average assets. Except for agricultural loans, all categories of nonperforming loans rose at District banks in 1995, with consumer loans exhibiting the largest increase (up 35 percent). In the consumer loan category, credit card loans proved particularly troublesome. Although credit card loans accounted for just 12.5 percent of District consumer loans at year-end, nonperforming credit card loans accounted for 24.4 percent of all nonperforming consumer loans.
Even more noteworthy than the rise in consumer nonperforming loans was the 25.2 percent increase in nonperforming real estate loans. Real estate loans dominate District loan portfolios, accounting for 54 percent of total loans. A $34.4 million hike in nonperforming construction loans and a $38.7 million uptick in nonperforming one- to four-family residential loans explain the increase in nonperforming real estate loans.
A survey of the individual states that in whole or in part make up the Eighth District reveals that increases in nonperforming loans were fairly widespread in 1995. Indeed, the level of nonperforming loans rose in six of the seven District states, although by different amounts. Arkansas posted the largest increase in nonperforming loans (25 percent), followed by Kentucky (16.6 percent), Tennessee (11.1 percent), and Missouri (10.8 percent). Illinois and Mississippi saw more modest growth in nonperforming loans (3.3 percent and 0.3 percent, respectively). Only Indiana enjoyed lower levels of nonperforming loans (down 6.2 percent). The lower level resulted from a 17.9 percent decline in nonperforming real estate loans which, in turn, was fueled by a 69.1 percent drop in nonperforming construction and land development loans.
Behind the Numbers
Given the usual cyclical patterns in the growth of total loans and nonperforming loans, the jump in District nonperforming loans is not surprising. (See Chart 1.) Historically, loan growth is procyclical; that is, banks expand their loan portfolios as loan demand rises during expansions. As the expansion reaches its late stages, fewer high quality loans are available, causing some banks to let credit standards slip so that they can maintain loan growth. Also, as the economy weakens, loans to cyclical industries, like real estate, tend to slide into the nonperforming column.
District Nonperforming Loans Jump...
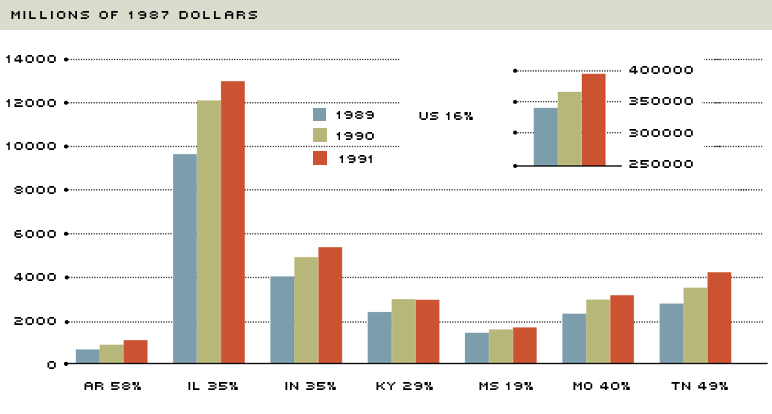
When gauged by the percentage change in nonperforming loans, the trend in District loan quality appears worrisome. District-wide, nonperforming loans shot up by over 30 percent last year, more than 15 times the increase for U.S. peer banks.
Statistical analysis indicates that increases in District nonperforming loans typically follow spurts in loan growth by an average of five to 10 quarters.1 As the Midwestern economy strengthened in late 1993 and 1994, District banks began to aggressively expand their loan portfolios. For example, between March 31, 1994, and June 30, 1995, annualized quarterly loan growth averaged 12.4 percent—more than twice the growth rate for U.S. peer banks during the same time period. A bit ahead of the usual five quarter lag, the annualized quarterly growth rate of nonperforming loans swung sharply upward at District banks in the first quarter of 1995. Since then, the annualized quarterly growth rate has averaged 27.7 percent.
Viewed from another perspective, however, the dramatic rise in District nonperforming loans reflects nothing more than a phenomenon that statisticians term the "low-base effect." Small absolute changes in nonperforming loans translate into large percentage changes if the initial level of nonperforming loans is low, and, in late 1994 nonperforming loans reached a record low.2 In fact, in December 1994, District nonperforming loans dipped to a 10-year low of $668.64 million. (See Chart 2.) This compares with the 10-year high of $1.52 billion in March 1987 and the 10-year average of $1.20 billion.
...But Large Increase Reflects "Low-Base Effect"
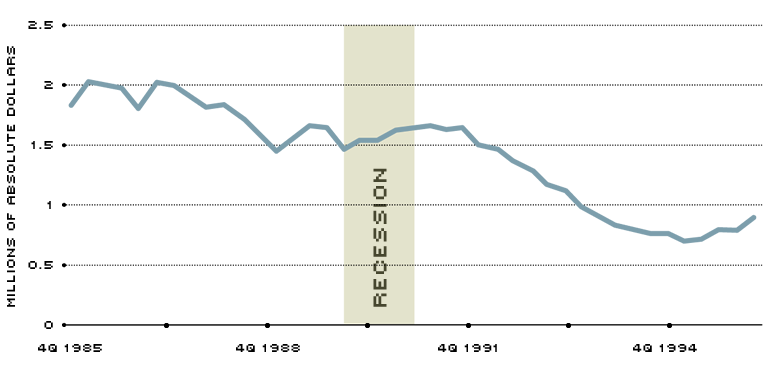
But, the large percentage increase in 1995 actually reflects the "low-base effect"—the tendency for small dollar changes to translate into large percentage changes when the initial level of nonperforming loans is low. Moreover, the overall level of nonperforming loans has declined through most of the last decade and remains low by historical standards.
Moreover, the overall level of nonperforming loans—when viewed relative to total loans—compares favorably with U.S. peer banks, as well as historical averages. Although nonperforming loans as a percentage of total loans rose 12 basis points in 1995 to finish the year at 0.78, the ratio is still significantly below the U.S. peer bank average of 1.07 percent. The District ratio is also well below the normal District range of 1.5 percent to 2.0 percent. (The average for District banks from the fourth quarter of 1985 to the fourth quarter of 1995 was 1.61 percent.) Looking at the individual loan categories, only the ratio of nonperforming consumer loans to total consumer loans appears high relative to historical levels. In December 1995, the nonperforming consumer loan ratio stood at 0.63 percent— still quite low, although slightly higher than the five-year average of 0.58 percent. For agricultural loans, real estate loans and commercial loans, the ratios of nonperforming loans to total loans in each category were well below their five-year averages.
Healthy Coverage Ratio
One measure of a bank's ability to deal with loan quality problems is the coverage ratio—the ratio of loan loss reserves to nonperforming loans. The loan loss reserve account contains an amount of funds deemed sufficient to cover estimated future loan losses; banks add to this account over time with funds from current earnings, called loan loss provisions. When a loan is charged off (i.e., deemed uncollectible), the loan loss reserve account is reduced by the amount of the failed loan. The coverage ratio indicates whether a bank has adequately anticipated charge-offs. A low coverage ratio implies that a sudden decrease in loan quality could seriously reduce earnings.
According to the coverage ratio measure, District banks appear well-positioned to deal with the recent rise in nonperforming loans. Although the increase in nonperforming loans dropped the District's coverage ratio 54 percentage points in 1995, the year-end District average of 196.5 percent is roughly double the 80 percent to 100 percent range considered by bank analysts to be adequate for an individual bank. Also, the District's average ratio compares favorably with the U.S. peer bank average of 177.0 percent.
Quality Will Not Suffer
In short, although nonperforming loans have climbed recently, a careful look at the data reveals several reasons why loan quality is not a problem in the Eighth District. First, the jump is a predictable response to prior increases in District bank lending. Second, the percentage change is magnified by the previously discussed "low-base effect," and third, relative to total loans, nonperforming loans are well below U.S. peer bank levels and historical norms. Even consumer loan quality, which has attracted much national scrutiny of late, appears sound in the Eighth District when viewed relative to total consumer loans. Higher loan loss provisions may reduce District earnings somewhat in the coming quarters, but there is no evidence to suggest that a serious loan quality problem will emerge to torpedo earnings.
Endnotes
- See Mark D. Vaughan and Dusan Stojanovic. "Cycles in Lending and Asset Quality: A Look at Eighth District Data." Internal Banking Supervision Division policy memo, Federal Reserve Bank of St. Louis, (Summer 1996). [back to text]
- For example, suppose the initial level of nonperforming loans is $1. In this case, a $1 rise in nonperforming loans represents a 100 percent jump. In contrast, if the initial level is $100, the $1 rise represents only a 1 percent increase. [back to text]
Views expressed in Regional Economist are not necessarily those of the St. Louis Fed or Federal Reserve System.
For the latest insights from our economists and other St. Louis Fed experts, visit On the Economy and subscribe.
Email Us
