

Have the Trends in Housing Bottomed Out?
The housing market has been a drag on the economy since the real estate bubble burst a few years ago. As news continues to emerge from the housing market, it is important to look at the overall trends of different aspects of the U.S. market since
the downturn.
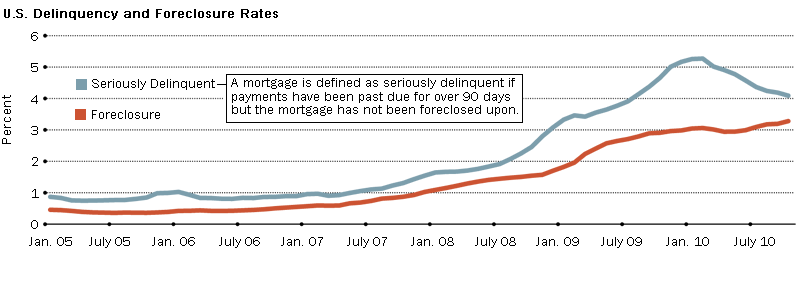
Higher delinquencies and foreclosures have been a consistent feature of the mortgage market since 2005. Figure 1 shows the increasing foreclosure rates for the past two years. As of October 2010, the foreclosure rate stood at about 3.3 percent. In contrast, the percentage of mortgages in serious delinquency peaked in early 2010 and has been on the decline since, dropping to about 4.1 percent in October. (We define a mortgage as seriously delinquent if payments have been past due for over 90 days but the mortgage has not been foreclosed upon.) A decline in serious delinquencies would imply that foreclosure rates in the near future are likely to fall, absent any surge in new delinquencies. Of course, there is little doubt that these rates are significantly higher than normal and that mortgage markets in the U.S. are still under significant stress. To put things in perspective, seriously delinquent rates and foreclosure rates averaged 0.84 percent and 0.46 percent over the first half of the decade, respectively.
Another Sign of Hope
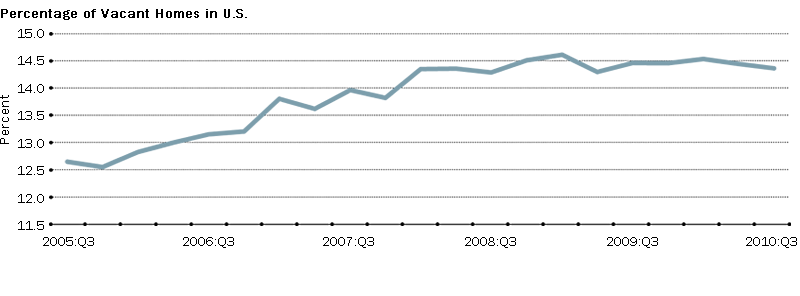
On a brighter note, inventories of vacant homes have begun to come down after increasing consistently over the past few years (Figure 2). According to the Census Bureau, the total number of housing units increased to 130.68 million in the third quarter of the year. Although the levels of housing units are always increasing, the upward trend has been dampened since the crisis. Of the total housing stock, roughly 18.77 million units—or 14.4 percent of the total—were vacant in the third quarter of 2010. These levels are down from the second quarter of the year, although relatively elevated compared with the vacancy rate of less than 13 percent in 2005. Naturally, the increase in foreclosures has contributed to the high percentage of vacant homes.
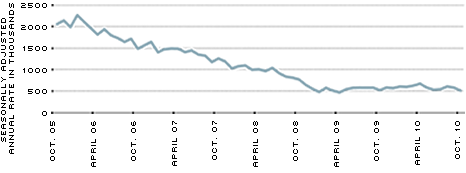
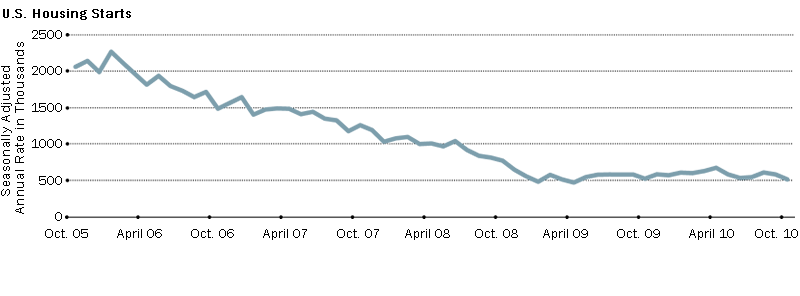
At the same time, there has been a sharp decline in the demand for housing. Housing starts have been decreasing slightly over the past few months, although the overall trend has not seen a significant change since starts bottomed out in January 2009 at a bit less than 500,000 on an annualized basis. (See Figure 3.) This October, there were 519,000 housing starts on an annualized basis, about 69,000 fewer than in September.
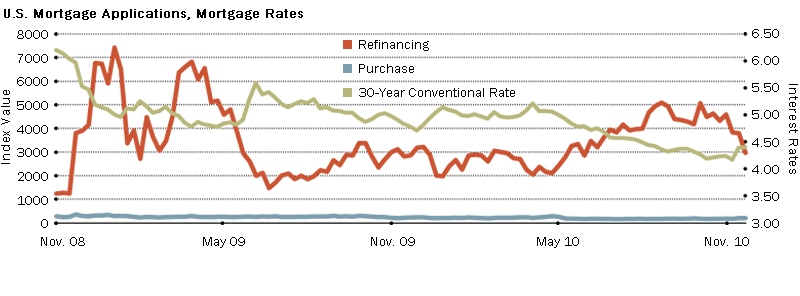
The decrease in housing demand is best viewed in terms of loan application indices compiled by the Mortgage Bankers Association.1 Loan applications for purchases in recent years have remained significantly low and substantially below loan applications for refinances. Refinances typically occur in booms, usually at times of low rates (because households seek to reduce obligations by switching to a lower mortgage rate) or at times of high price appreciation (because homeowners tend to cash out the equity appreciation). As shown in Figure 4, applications for refinances have increased with decreases in the conventional mortgage rate.2 There have been two refinance booms since mid-2008. The first occurred with a drop in the mortgage rates around the end of 2008 and the beginning of 2009. The second occurred with another drop in the mortgage rates around the second half of 2010. In early December, the conventional mortgage rate was roughly 4.46 percent, which was up from the low of 4.17 percent in mid-November.
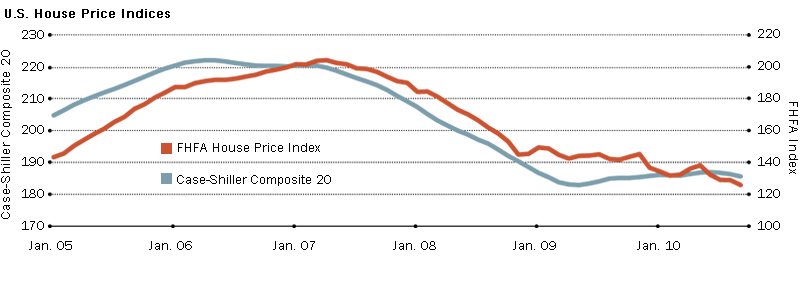
Another summary indicator of the housing market is the home prices themselves. Figure 5 shows the Federal Housing Finance Agency house price index and the Case-Shiller Home Price Composite 20 index. In September, housing prices decreased between 0.68 percent and 0.80 percent, depending on the index. These indices are significantly down from their peak.
More recently, the mortgage market showed some signs of recovery. The National Association of Realtors Index tracks home contracts that have been signed but not closed. The index gained 10.4 percent in October, suggesting a jump in overall existing home sales at least for November.
The Role of the Overall Economy
Needless to say, the future path of house prices will depend not only on the trends in housing but also the condition of the overall economy, including the unemployment rate. As of November, the national unemployment rate stood at 9.8 percent with continuing insipid growth in the economy overall. If the unemployment rate continues to increase and the economy suffers further job losses, higher default rates on mortgages could occur, leading to lower prices. A fall in house prices could imply that more mortgages are underwater—that is, the amount homeowners owe on their mortgages exceeds the current market price of their homes. As recent research has shown, this could lead, in turn, to further defaults, exacerbating the stress in mortgage markets.3
Expectations of economic conditions and future house prices also play a significant role, as do interest rates. If prospective buyers expect home prices to decline, they are more likely to postpone purchasing a home in favor of renting. Also, if long-term rates rise, the recent slide in mortgage rates could reverse; such a move, in turn, would dampen mortgage demand.
Weaker job growth and higher mortgage rates are unlikely to spur demand for housing. Until people feel the economy's prospects are definitely getting better, they will remain less likely to buy a home.
U.S. Delinquency and Foreclosure Rates
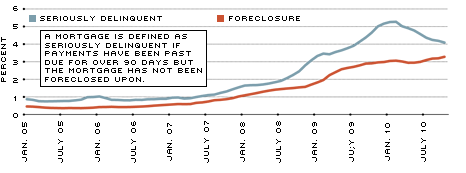
SOURCE: Staff calculations based on data provided by LPS Applied Analytics
Percentage of Vacant Homes in U.S.
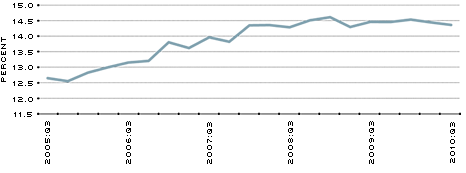
SOURCES: Haver Analytics, Census Bureau
U.S. Mortgage Applications, Mortgage Rates
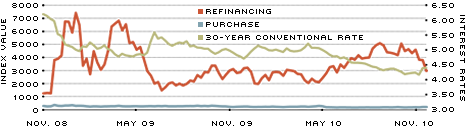
SOURCES: Haver Analytics, Mortgage Bankers Association and Federal Home Loan Mortgage Corp.
U.S. House Price Indices
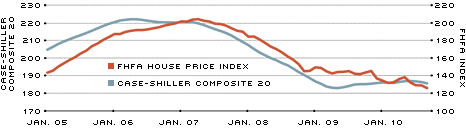
SOURCES: Haver Analytics, Standard & Poor's Fiserv, MacroMarkets LLC and Federal Housing Finance Agency (FHFA)
Endnotes
- For details on the creation of the index, see Frumkin. [back to text]
- The mortgage rate given here is for a 30-year, fixed-rate, prime, conventional, conforming mortgage. For details, see www.freddiemac.com/pmms/abtpmms.htm [back to text]
- See Elul et al. [back to text]
References
Elul, Ronel; Souleles, Nicholas S.; Chomsisengphet, Souphala; Glennon, Dennis; and Hunt, Robert M. "What 'Triggers' Mortgage Default?" Working Paper No. 10-13, Federal Reserve Bank of Philadelphia, April 1, 2010. See http://ssrn.com/abstract=1596707
Frumkin, Norman. Guide to Economic Indicators. Fourth edition. London: M. E. Sharpe, 2006, pp. 182-84.
Views expressed in Regional Economist are not necessarily those of the St. Louis Fed or Federal Reserve System.
For the latest insights from our economists and other St. Louis Fed experts, visit On the Economy and subscribe.
Email Us
