

Household Participation in Stock Market Varies Widely by State
From 1928 to 2016, the average annual stock return was about 8 percentage points higher than the return on three-month Treasury bills. This leads to sizable return gaps over time: $100 investments in stocks and in Treasury bills in 1928 would have yielded nearly $329,000 and $2,000, respectively, 88 years later.1
Given the high return of stocks, it is puzzling that many households do not participate in the stock market and, hence, forgo the high return. In addition, the nonparticipation behavior is at odds with modern portfolio theory. The theory implies that all households should invest at least a fraction of their wealth in stocks in order to take advantage of the equity premium. However, the data show that many households do not participate in financial markets.
The inability of modern portfolio theory to explain what is observed in the data leads to a “participation puzzle.” A common explanation of this puzzle is the individual participation cost, which includes both monetary and nonmonetary costs. The monetary costs are relatively straightforward, including transaction or brokerage fees. The nonmonetary costs are broadly defined to be the cognitive and time costs of understanding the investment object or processing previous experiences with stock markets. The participation cost, especially the nonmonetary costs, could vary widely across the population.
While this participation puzzle has been well-documented at the national level, this article takes a first step in exploring whether the rates vary geographically. The aim is to see if the participation rate at the national level occurred homogeneously across states or if people in some states participated at a higher rate than others.
If the data indicate that there are regional differences in these rates, academic researchers could explore these disparities to better understand and resolve the puzzle. In addition, a better understanding of households’ investment decisions across regions could improve the quality and effectiveness of conducting government policy.
To answer this question, we employed the IRS’ individual income and tax data for 2014, the most recent year available. The data contain information on income from taxable dividends. We approximated the stock market participation rate as the ratio of the number of tax returns with dividend income to the number of total tax returns filed.
We used tax return data because of its availability at the state level. However, there is a shortcoming in doing so. Given that not all companies pay dividends out of their profits each year and that the dividend incomes of retirement accounts are not taxable, our figure underestimates the true participation rate and should therefore be considered a lower bound. Fortunately, this shortcoming might be less of a concern when comparing participation rates across states, as the downward bias is likely to affect states uniformly.
Wide Disparities among States
The data show a large variation in stock market participation rates across the United States. The disparities are sizable, with rates ranging from 10.5 percent in Mississippi to 26.6 percent in Connecticut. This seems reasonable, as the average household income is higher in Connecticut than in Mississippi and the existing literature shows that the participation rate increases with income.2
However, this is not the whole story. Even when controlling for household income level, the large variation in participation across states prevails. Figure 1 plots the participation rates for Connecticut, Mississippi and the United States across different income groups. The participation gap remains large for each group, indicating that household income level does not entirely lead to differences in participation rates.
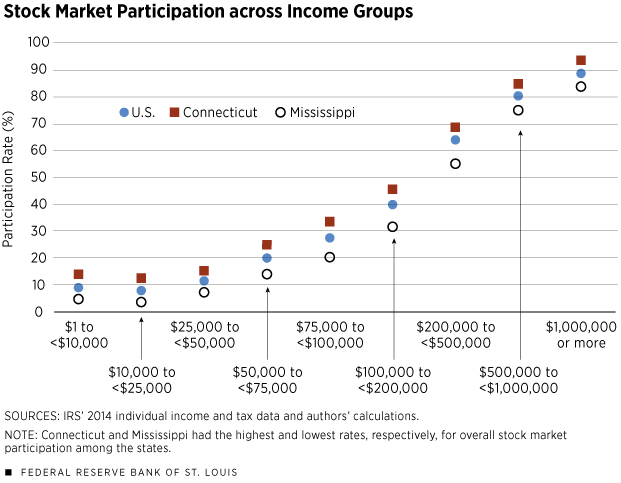
Note that this holds even for those groups with high income. In the income group ranging from $100,000 up to but not including $200,000, the participation gap stands at 14.2 percentage points (31.5 percent in Mississippi versus 45.7 percent in Connecticut).
This finding is even more puzzling when the cost of living is taken into consideration. The cost of living is lower in Mississippi, so given the same income level, those with high incomes in Mississippi should have more funds to invest in the stock market than comparable households in Connecticut.3
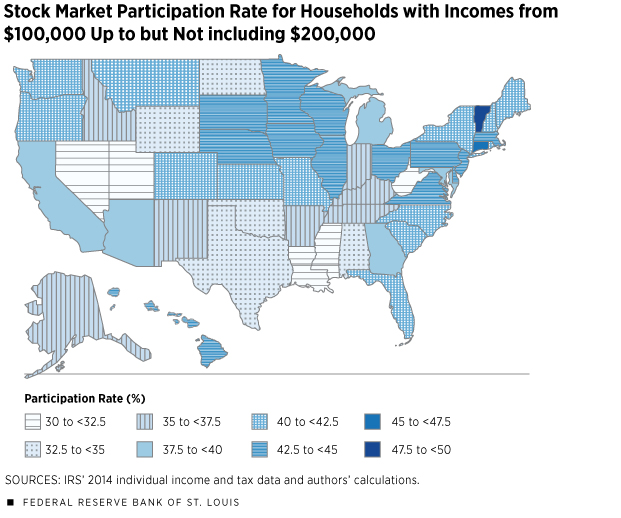
This pattern is not specific to these two states. Figure 2 maps the stock market participation rates across states for those with a relatively high household income: $100,000 up to but not including $200,000. Darker shades of blue indicate higher participation rates. Participation ranges from 30.7 percent in Utah to 47.5 percent in Vermont. This finding suggests that there might be some regional factors that are affecting the stock market participation rates.
What might these factors be? It is difficult to argue that individual participation costs are able to explain such large differences in participation rates from state to state. In today’s information age, the monetary costs of participating should be uniform across the country. There are many online brokers offering low-cost and convenient services for stock market transactions. Moreover, the differences in nonmonetary costs should be similar across states after controlling for income.
For example, given the same level of income, it is unlikely that the cognitive cost of processing investment knowledge could vary enough to explain the variation in participation across states.
Exploring the true regional factors is beyond the scope of this article. However, a potential explanation is the awareness of financial planning, which could be influenced heavily by the surrounding community. If households have less exposure to the importance of financial planning, then they are less likely to spend time and effort on improving investment decisions regardless of participation costs.
The investment decision matters for the welfare of households. Good financial decision-making could help households hedge against their income risks and achieve a better life. Although it is not necessarily the case that stock market participants are more financially sophisticated than nonparticipants, understanding the participation decisions made by households is important to both academic researchers and policymakers. An example is the shortage of retirement savings in the United States. If households cannot make the right investment decisions and, thereby, jeopardize their return on savings, then households are not only likely to save less but could fail to accumulate enough assets for retirement.
YiLi Chien is an economist, and Paul Morris is a senior research associate, both at the Federal Reserve Bank at St. Louis. For more on Chien’s research, see https://research.stlouisfed.org/econ/chien.
Endnotes
- See Damodaran for the detailed numbers. The return gap remains sizable even if one considers 10-year bonds instead of three-month Treasury bills. [back to text]
- See Guiso and Sodini, who provide an excellent survey on the literature. [back to text]
- Given each state, we see that the participation rate increases significantly with income, which confirms the findings in the empirical literature. [back to text]
References
Damodaran, Aswath. Annual Returns on Stock, T. Bonds and T. Bills: 1928–Current. See http://pages.stern.nyu.edu/~adamodar/New_Home_Page/datafile/histretSP.html.
Guiso, Luigi; and Sodini, Paolo. Household Finance: An Emerging Field, in George M. Constantinides, Milton Harris and Rene M. Stulz, eds., Handbook of the Economics of Finance, Vol. 2, Part B. Oxford, England, and Amsterdam: North Holland, 2013, pp. 1,397-532. See http://dx.doi.org/10.1016/B978-0-44-459406-8.00021-4.


Views expressed in Regional Economist are not necessarily those of the St. Louis Fed or Federal Reserve System.
For the latest insights from our economists and other St. Louis Fed experts, visit On the Economy and subscribe.
Email Us
