

How Does U.S. Income Inequality Compare Worldwide?
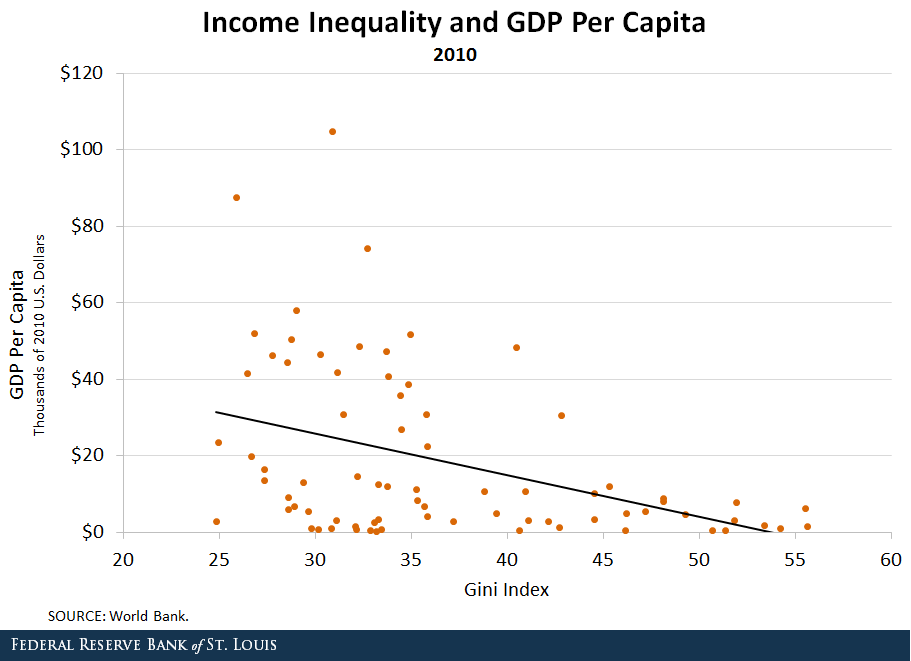
Rich countries tend to have lower income inequality than developing countries. The figure below shows a negative relationship between the level of income per capita (which is a measure of technological progress) and the Gini coefficient of income (which is a measure of inequality within a country).1
Income Inequality by Region
When we dig deeper into the data, we observe that the countries with the highest income inequality are countries in Latin America and Africa. Advanced economies, on the other hand, display lower income inequality.
To examine these patterns further, we placed the countries shown in the figure into six regional groups and computed the average Gini coefficient for each group. The results are in the table below.
| Average Gini Coefficient and GDP Per Capita By Region in 2010 | ||
|---|---|---|
| Average Gini Coefficient | Average GDP Per Capita | |
| Latin America and the Caribbean | 48.82 | $6,443.76 |
| Africa | 44.26 | $1,136.30 |
| East Asia and Pacific | 37.40 | $9,672.39 |
| U.S. and Canada | 37.07 | $47,910.68 |
| Europe | 31.30 | $38,826.47 |
| Eastern Europe and Central Asia | 30.65 | $4,317.20 |
| SOURCE: World Bank and authors' calculations | ||
Latin America and Africa have the highest inequality with a Gini of 48.82 and 44.26, respectively, whereas Europe and more advanced economies have lower income inequality. Consistent with the results of the figure, the table shows a negative correlation between the level of income per capita and the Gini coefficient to some extent.
Income Inequality by Country
When we analyze countries within each group separately, interesting patterns emerge. For instance, income inequality in the U.S. is large, despite the U.S. having one of the highest levels of income per capita in our sample. Specifically, the Gini coefficient of the U.S. was 40.46 in 2010, very close to the average Gini coefficient of African countries in our sample.
In contrast, Nordic countries in Europe—such as Finland and Sweden—have a similar income per capita as that in the U.S., but much lower Gini coefficients.
The lower inequality in these countries could be explained by a tax system that redistributes income across countries and includes generous transfers like social security, health insurance and unemployment benefits. In fact, poorly designed tax systems, tax evasion and tax avoidance are part of the reason why Latin American countries have the largest Gini coefficients.
Why Does the U.S. Have High Income Inequality?
The high income inequality in the U.S. can be explained by several factors. One is the redistribution and imperfect tax system we illustrated above. According to a 2013 paper, top tax rates in the U.S. have moved in the opposite direction from top pre-tax income shares for a few decades, supported by the belief that rewarding top earners might spur more growth and entrepreneurship.2
Also, technological progress has increased productivity, which, in turn, has led to the relative price of investment falling. As that happens, firms might substitute capital for labor, causing the labor share to fall. The declines in labor share lead to higher inequality.3
High income inequality has negative consequences for the political stability of a country and economic growth in the long run.4 Policies aimed at increasing the quality of the education system, as well policies that improve the redistributive role of the tax system, may help avoid the negative effects of income inequality.
Notes and References
1 The Gini coefficient measures how far an economy is from a situation in which everyone has the same level of income. The range of this coefficient goes from zero to one, with zero indicating perfect equality and one perfect inequality.
2 Alvaredo, Facundo; Atkinson, Anthony; Piketty, Thomas and Saez, Emmanuel. “The Top 1 Percent in International and Historical Perspective.” Journal of Economic Perspectives, Summer 2013, Vol. 27, Issue 3, pp. 3-20.
3 Santacreu, Ana Maria; and Zhu, Heting. “How Income Inequality Is Affected by Labor Share.” Federal Reserve Bank of St. Louis On the Economy. July 31, 2017.
4 Birdsall, Nancy. “Why Inequality Matters: Some Economic Issues.” Ethics & International Affairs, September 2001, Vol. 15, Issue 2, pp. 3-28. Krugman, Paul. “Why Inequality Matters.” The New York Times, Dec. 15, 2013.
Additional Resources
- On the Economy: How Is Income Inequality Measured?
- On the Economy: How Income Inequality Is Affected by Labor Share
- On the Economy: The Effect of Aging on Wealth Inequality


This blog offers commentary, analysis and data from our economists and experts. Views expressed are not necessarily those of the St. Louis Fed or Federal Reserve System.
Email Us
All other blog-related questions
