

The Federal Budget: How the U.S. Got Here, and Where It Is Headed
Since 2007, government debt as a percentage of gross domestic product (GDP) has climbed from 35 percent to a projected 74 percent this year. Such growth was significantly affected by large-scale fiscal measures taken in response to the 2007-2008 financial crisis and Great Recession and by subsequent measures to curb the growing deficit. A recent Regional Economist article by Fernando Martin, a senior economist with the Federal Reserve Bank of St. Louis, examined the overall fiscal response to the crisis and the implications of current budget projections for the next decade.
The following tables show major components of the federal budget, averaged over six periods since 1971. The first table displays revenues.
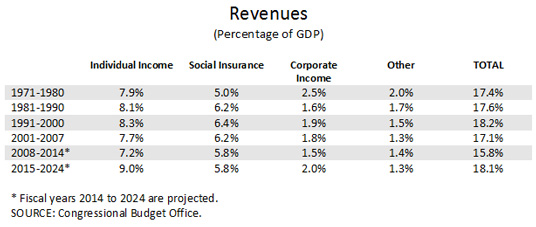
Federal revenue as a percentage of GDP peaked during the 1990s, then fell due to a series of tax provisions enacted in the 2000s plus a temporary reduction in Social Security payroll taxes for employees in 2011 and 2012. Revenue is expected to rise significantly, mostly due to scheduled increases in taxes on individual income. Over the next decade, the Congressional Budget Office (CBO) expects federal revenue over GDP to average 18.1 percent and to reach 18.3 percent in 2024.
The next table shows federal outlays.
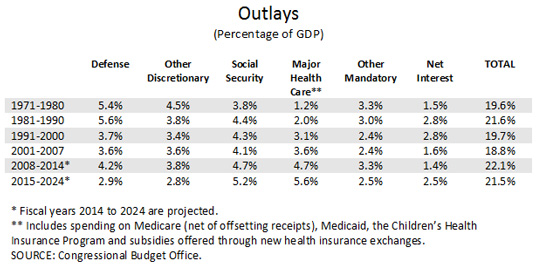
Martin noted that outlays as a percentage of GDP were declining up to the recession, averaging 18.8 percent in 2001-2007 before climbing to 22.1 percent in 2008-2014. He said, “At first glance, the recent increase in spending appears permanent, rather than a temporary response to the economic downturn. However, looking at the composition of expenditures reveals pre-existing trends that dominate the budget outlook.”
- Defense spending has been declining relative to the U.S. economy and is projected to keep falling. Defense spending over GDP has been persistently below 5 percent for the past two decades and is projected to average 2.9 percent in 2015-2024.
- Nondefense discretionary spending increased significantly in 2009-2012, but is expected to decline steadily over the next decade. The CBO expects this spending to average 2.8 percent for 2015-2024.
- Mandatory expenditures, on the other hand, have been growing consistently. This includes Social Security, Medicare, Medicaid, unemployment insurance and assistance programs. Spending for Social Security and major health care programs alone is expected to reach almost 12 percent of GDP by 2024.
- Net interest has been significantly lower in the 2000s than in the previous two decades. However, interest payments over GDP are expected to increase significantly over the next decade, reaching 3.3 percent by 2024.
Martin concluded, “The outlook for the next 10 years shows that both revenue and expenditures will reach historically high levels for a period without a major military conflict (of the magnitude of the Civil War, for example, or the two world wars). The added tax burden is expected to fall mostly on income earned by individuals, as opposed to hikes in Social Security contributions or corporate taxes.
“Although discretionary spending will continue declining as a fraction of the economy, entitlements will drive total expenditures persistently higher than prerecession levels. Since the growth of spending is expected to outpace the growth in revenue, deficits will continue to pile up, and the public debt will keep on growing. Coupled with an expected increase in interest rates, the burden of servicing the public debt will become a larger component of the budget. How much larger will depend critically on the future evolution of interest rates. Current CBO projections estimate average deficits of 3.3 percent of GDP for 2015-2024, which is almost twice the precrisis 2001-2007 average but about half the 2008-2014 average. Debt in the hands of the public is projected to continue growing as a percentage of GDP, albeit at a much slower pace than during the last recession. By 2024, it will reach close to 80 percent, a figure not seen since 1948, after the end of World War II.”
Additional Resources
- Regional Economist: The Federal Budget: How the U.S. Got Here, and Where It Is Headed
- On the Economy: Recent ECB Policy and Inflation Expectations
- On the Economy: Obstacles and Potential Opportunities for Economic Growth in India
This blog offers commentary, analysis and data from our economists and experts. Views expressed are not necessarily those of the St. Louis Fed or Federal Reserve System.
Email Us
All other blog-related questions
