

U.S. Income Inequality: It's Not So Bad
Each year, the U.S. Census Bureau releases data on the income levels of America’s households. A comparison of these annual data over time reveals that the income for wealthier households has been growing faster than the income for poorer households—real income for the wealthiest 5 percent of households rose by 14 percent between 1996 and 2006, while the income for the poorest 20 percent of households rose by 6 percent. As a result of these differences in income growth, the income of the wealthiest 5 percent of households was 8.1 times that of the income of the poorest 20 percent of households in 1996 and increased to 8.7 times by 2006. By these figures, a common conclusion is that income inequality in the United States has increased.
The apparent increase in U.S. income inequality has not escaped the attention of policymakers and social activists who support public policies aimed at reducing income inequality. However, the common measures of income inequality that are derived from the census statistics exaggerate the degree of income inequality in the United States for several reasons. Furthermore, although income inequality is seen as a social ill by many people, it is important to understand that income inequality has many economic benefits and is the result of, and not a detriment to, a well-functioning economy.
An Inaccurate Picture
The Census Bureau essentially ranks all households by household income and then divides this distribution of households into quintiles of equal size.1 Finding the highest ranked household in each quintile then provides the upper income limit for each quintile.2 Comparing changes in these income limits over time for different quintiles reveals that income for the wealthier households has been growing faster than the income for poorer households, thus giving the impression of an “increasing income gap” or “shrinking middle class.”
One big problem with using the census income statistics to infer income inequality is that these statistics only provide a snapshot of the income distribution at a single point in time. The statistics do not consider the reality that the income for many households changes over time, i.e., incomes are mobile. The income of most people increases over time as they move from their first low-paying job in high school to a better paying job later in their lives. It is also true that some people lose income over time due to business cycle contractions, demotions, career changes, retirement, etc. The point is that individuals’ incomes are not constant over time, which implies that the same households are not in the same income quintiles over time. Thus, comparing different income quintiles over time is the proverbial “comparing apples to oranges” because incomes of different people are being compared at different stages in their earnings profile.
The U.S. Treasury released a study in November 2007 that examined income mobility in the U.S. from 1996 to 2005.3 Using data from individual tax returns, the study documented a household’s movement along the distribution of real income over the 10-year period. As shown in Figure 1A, the study found that nearly 58 percent of the households that were in the lowest income quintile (lowest 20 percent) in 1996 moved to a higher income quintile by 2005. Similarly, nearly 50 percent of the households in the second lowest quintile (20 percent to 40 percent) in 1996 moved to a higher income quintile by 2005. Even a significant number of households in the third and fourth income quintiles in 1996 moved to a higher quintile in 2005.
The Treasury study also documented falls in household income between 1996 and 2005. This is most interesting when considering the richest households. As shown in Figure 1B, more than 57 percent of the richest 1 percent of households in 1996 fell out of that category by 2005. Similarly, more than 45 percent of the households having the top 5 percent of income in 1996 fell out of that category by 2005.
The main point is that, over time, a significant number of households move to higher positions along the income distribution and a significant number move to lower positions along the income distribution. Common reference to “classes” of people (e.g., the lowest 20 percent, the richest 10 percent) is very misleading because income classes do not contain the same households and people over time.
Another problem with the inequality statistics is that they do not consider the noncash resources received by lower income households and the tax payments made by wealthier households to fund these transfers. Lower income households annually receive tens of billions of dollars in subsidies for housing, food and medical care. None of these is considered income by the Census Bureau.4 Thus, the resources available to lower-income households are actually much greater than is suggested by their income. On the other hand, these noncash payments to lower income households are funded through taxpayer dollars, mostly from wealthier households since they pay a majority of overall taxes. One research report estimates that the share of total income earned by the lowest income quintile increases roughly 50 percent, whereas the share of total income earned by the highest income quintile drops roughly 7 percent when transfer payments and taxes are considered.5
The census statistics also do not consider the fact that the households in each quintile contain different numbers of people, and it is differences in income across people that provide a clearer measure of inequality. Lower income households tend to consist of single people with low earnings, while higher income households tend to be married couples with multiple earners.6 Thus, lower income households have fewer people than higher income households, thereby skewing the income distribution. When considering household size along with transfers received and taxes paid, the income share of the lowest quintile nearly triples and the income share of the highest quintile falls by 25 percent.7
Is Policy Needed?
Income inequality will still exist even if these income inequality statistics are adjusted to account for the aforementioned factors.8 Given the negative attention income inequality receives in the popular press, an important question is whether reducing income inequality is worthy of public policy. It is important to understand that income inequality is a byproduct of a well-functioning capitalist economy. Individuals’ earnings are directly related to their productivity. Wealthy people are not wealthy because they have more money; it is because they have greater productivity. Different incomes, thus, reflect different productivity levels.
The unconstrained opportunity for individuals to create value for society, which is reflected by their income, encourages innovation and entrepreneurship. Economic research has documented a positive correlation between entrepreneurship/innovation and overall economic growth.9 A wary eye should be cast on policies that aim to shrink the income distribution by redistributing income from the more productive to the less productive simply for the sake of “fairness.” 10 Redistribution of wealth would increase the costs of entrepreneurship and innovation, with the result being lower overall economic growth for everyone.
Poverty and income inequality are related, but only the former and not the latter deserves a policy response. Sound economic policy to reduce poverty would lift those out of poverty (increase their productivity) while not reducing the well-being of wealthier individuals. Tools to implement such a policy include investments in education and job training.
Income inequality should not be vilified, and public policy should encourage people to move up the income distribution and not penalize them for having already done so.
Figure 1A
Movement to Higher Income Quintiles
1996-2005
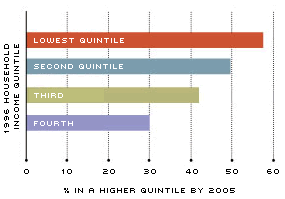
SOURCE: Treasury Department
Figure 1B
Movement to Lower Income Group
1996-2005
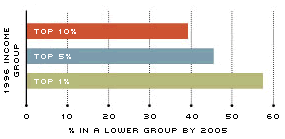
SOURCE: Treasury Department
One problem with popular portrayals of the income gap is that they show income distribution at a single point in time. But for many households, income changes over time. The low-paying jobs from high school days usually give way to better-paying jobs later in life. Figure 1A shows the percentage of households that moved from one income group to another between 1996 and 2005. For example, nearly 58 percent of the households in the lowest income quintile in 1996 moved to a higher category by 2005. The reverse also happens, as shown in Figure 1B. Of those households that were in the top 1 percent in income in 1996, for example, more than 57 percent dropped to a lower income group by 2005.
Endnotes
- See www.census.gov/hhes/www/income/histinc/inchhdet.html. All data referred to here are from Table H-1. [back to text]
- Except the upper 20 percent, which is unlimited. The upper income limits for 2006 household income were: lowest quintile –$20,035; second quintile –$37,774; third quintile –$60,000; fourth quintile –$97,032. To be in the top 5 percent of all incomes in 2006, a household needed an income of $174,012. [back to text]
- See the Treasury Department. The report is available online at www.treasury.gov/press-center/press-releases/Pages/hp673.aspx. [back to text]
- The Census Bureau only considers money income as income. [back to text]
- See Rector and Hederman. [back to text]
- See various data from the U.S. Census Current Population Survey (2007), Table HINC-01, available at a href="http://pubdb3.census.gov/macro/032007/hhinc/new01_001.htm" target="_blank">http://pubdb3.census.gov/macro/032007/hhinc/new01_001.htm. [back to text]
- See Rector and Hederman. [back to text]
- The degree of income inequality is also less if one considers the purchasing power of different income groups. Broda and Romalis (2008) argue that the purchasing power of lower income groups has increased relative to higher income groups due to the fact that the goods that lower income people spend a greater percentage of their income on, such as food and clothing, have increased in price at a much slower rate than the goods and services that higher income groups tend to consume. [back to text]
- See Baumol et al., Link and Siegel, and Lazear for recent examples. [back to text]
- The economist Martin Feldstein argues that economic policy to reduce income inequality would only be appropriate if the well-being of society increases when overall societal wealth falls. [back to text]
References
Baumol, William J; Litan, Robert E.; and Schramm, Carl J. Good Capitalism, Bad Capitalism, and the Economics of Growth and Prosperity. New Haven, Conn.: Yale University Press, 2007.
Broda, Christian; and Romalis, John. “Inequality and Prices: Does China Benefit the Poor in America?” University of Chicago working paper, 2008.
Feldstein, Martin. “Income Inequality and Poverty.” NBER Working Paper 6770, National Bureau of Economic Research, October 1998.
Lazear, Edward P. “Productivity and Wages.” Business Economics, October 2006, Vol. 41, No. 4, pp. 39-45.
Link, Albert N.; and Siegel, Donald S. Innovation, Entrepreneurship, and Technological Change. New York: Oxford University Press, 2007.
Rector, Robert; and Hederman, Rea. “Two Americas: One Rich, One Poor? Understanding Income Inequality in the United States.” The Heritage Foundation, Aug. 24, 2004. See www.heritage.org/research/taxes/bg1791.cfm.
Treasury Department. “Income Mobility in the U.S. From 1996 to 2005.” Washington, D.C., 2007. See www.treasury.gov/press-center/press-releases/Pages/hp673.aspx.
Views expressed in Regional Economist are not necessarily those of the St. Louis Fed or Federal Reserve System.
For the latest insights from our economists and other St. Louis Fed experts, visit On the Economy and subscribe.
Email Us
